Demystifying Color Histograms: A Guide to Image Processing and Analysis
Mastering color histograms is indispensable for anyone involved in image processing and analysis. By understanding the nuances of color distributions and leveraging advanced techniques, practitioners can unlock the full potential of color histograms in various imaging projects and research endeavors.
Read the entire series
- Cross-Entropy Loss: Unraveling its Role in Machine Learning
- Batch vs. Layer Normalization - Unlocking Efficiency in Neural Networks
- Empowering AI and Machine Learning with Vector Databases
- Langchain Tools: Revolutionizing AI Development with Advanced Toolsets
- Vector Databases: Redefining the Future of Search Technology
- Local Sensitivity Hashing (L.S.H.): A Comprehensive Guide
- Optimizing AI: A Guide to Stable Diffusion and Efficient Caching Strategies
- Nemo Guardrails: Elevating AI Safety and Reliability
- Data Modeling Techniques Optimized for Vector Databases
- Demystifying Color Histograms: A Guide to Image Processing and Analysis
- Exploring BGE-M3: The Future of Information Retrieval with Milvus
- Mastering BM25: A Deep Dive into the Algorithm and Its Application in Milvus
- TF-IDF - Understanding Term Frequency-Inverse Document Frequency in NLP
- Understanding Regularization in Neural Networks
- A Beginner's Guide to Understanding Vision Transformers (ViT)
- Understanding DETR: End-to-end Object Detection with Transformers
- Vector Database vs Graph Database
- What is Computer Vision?
- Deep Residual Learning for Image Recognition
- Decoding Transformer Models: A Study of Their Architecture and Underlying Principles
- What is Object Detection? A Comprehensive Guide
- The Evolution of Multi-Agent Systems: From Early Neural Networks to Modern Distributed Learning (Algorithmic)
- The Evolution of Multi-Agent Systems: From Early Neural Networks to Modern Distributed Learning (Methodological)
- Understanding CoCa: Advancing Image-Text Foundation Models with Contrastive Captioners
- Florence: An Advanced Foundation Model for Computer Vision by Microsoft
- The Potential Transformer Replacement: Mamba
- ALIGN Explained: Scaling Up Visual and Vision-Language Representation Learning With Noisy Text Supervision
Computers view images in a three-dimensional array of numbers, often referred to as an image array. The number represents the pixels, while the three dimensions correspond to the primary colors: Red, Blue, and Green. The different pixel values make up the color intensities, contrast, and brightness and construct the image we see.
Many image processing applications rely on analyzing these pixel values. A color histogram is a popular method for visualizing the construction of an image. This visual element displays counts and visualizes the occurrence of each pixel value in an image. A higher count means an abundance of the pixel intensity and vice versa. The color histogram helps analyze image elements like color intensities, contrast, and shadows and is used by photo editors, graphic designers, and AI engineers.
This article will discuss the color histogram in detail. We will also implement it using code and examine its many applications.
What is a Color Histogram?
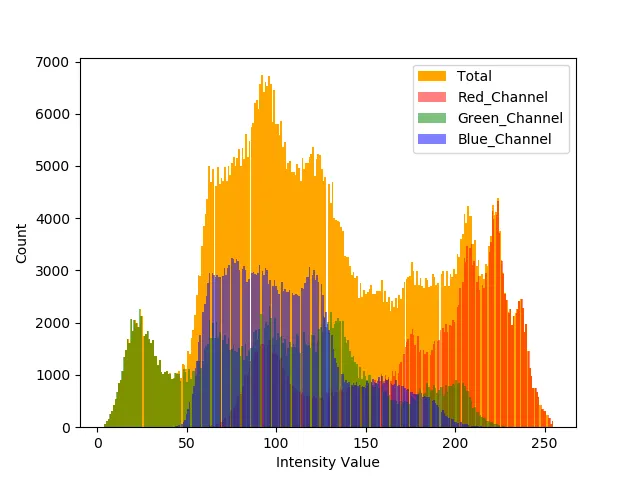
A color histogram is a graphical representation of the distribution of colors in an image. It counts the number of times each color appears in the image, representing the distribution of different color values as bars or lines. The horizontal axes represent the different pixel values, while the vertical displays the frequency of occurrence.

A Color Histogram - Source
Each image channel is typically visualized as a separate histogram for a more granular analysis. The pixel values range from 0 to 255, with 0 representing a darker pixel (black regions) and the brightness increasing as we move up the spectrum. The histogram helps understand the color composition, distribution, and brightness distribution across an image.
Histogram Binning
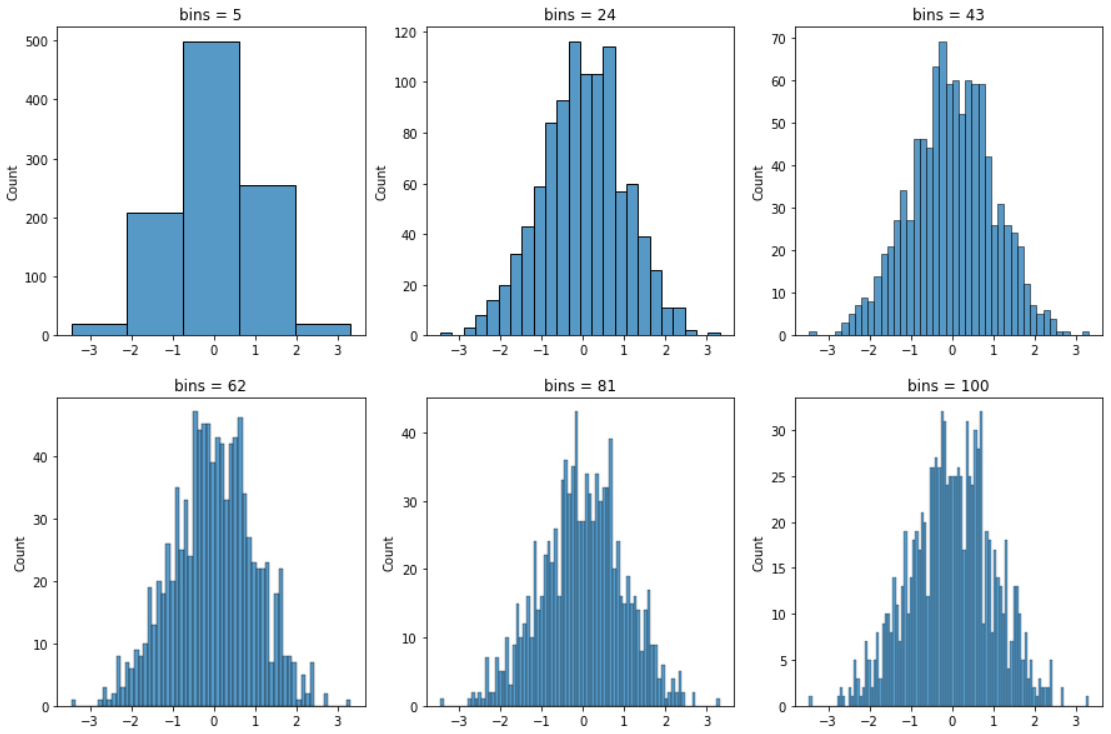
It is a common practice to group values before displaying them on a histogram. This is particularly helpful when the independent variable covers a wide range and needs to be efficiently displayed. These values are grouped into bins, and the bins are displayed.

Impact of Bin Size - Source
For example, in an image, pixels range from 0 to 255. Instead of creating 256 bars, we can create bins with a size of 20. This means that all values within 0 to 20, 20 to 40, and so on, will be represented with a single bar. The bins make it much easier to display and analyse the data distribution.
A cumulative color histogram can provide a more stable metric for comparisons, especially when images are quantized and subject to variations in lighting.
Generating Color Histograms from Input Image
Color histograms can be easily generated in Python using OpenCV and a few lines of code. Let’s walk through the steps required to build and analyze a color histogram.
Step 1: Load the Image
   import cv2
   import numpy as np
   import matplotlib.pyplot as plt

image = cv2.imread(image\_path)
This line reads the image from the specified path using OpenCV. By default, OpenCV reads images in BGR (Blue, Green, Red) format. These need to be explicitly converted to the RGB color space so they are displayed appropriately.
Step 2: Convert from BGR to RGB
image_rgb = cv2.cvtColor(image, cv2.COLOR\_BGR2RGB)

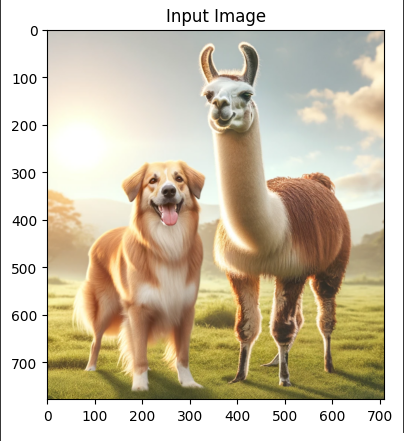
Input Image (AI-Generated)
Since OpenCV reads images in BGR format but matplotlib (a plotting library) displays images in RGB format, the image is converted to RGB. This ensures that the colors in the displayed image match what we expect to see.
Step 3: Convert to Grayscale histogram
image_gray = cv2.cvtColor(image, cv2.COLOR_BGR2GRAY)
Converting the image to a grayscale image is crucial for computing grayscale histograms. A grayscale image simplifies the analysis by reducing the image to a single channel, representing pixel intensity. This conversion helps in understanding the distribution of pixel intensities without the complexity of color information.
Step 4: Calculate Histograms for Each Color Channel
 for i, col in enumerate(colors):
    histogram = cv2.calcHist(\[image], \[i], None, \[256], \[0, 256]))
For each color channel (Blue, Green, Red), this loop calculates the histogram using cv2.calcHist. It divides the range of pixel intensities (0 to 255) into 256 bins and counts how many pixels fall into each bin. The result is a graph that shows the frequency of each intensity level for the channel.

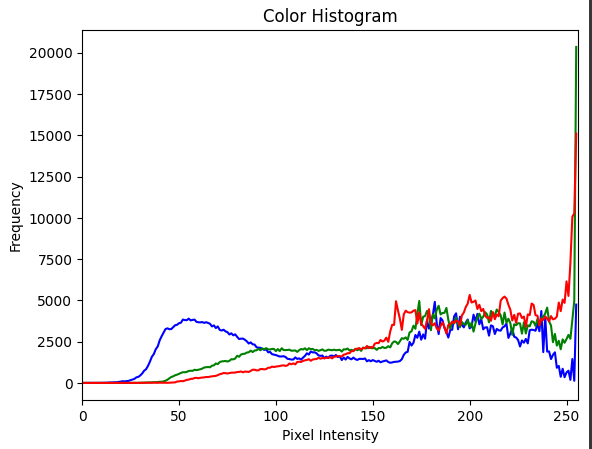
Generated Histogram
The generated histogram displays the three primary color channels present in our image. The x-axis (horizontal) represents the pixel intensity values ranging from 0 to 255 for each color channel. Since we have not specified a bin size, the default bin size is one, and each pixel value is displayed individually.
The value 0 corresponds to no intensity (black), and 255 corresponds to the full intensity of that color (red, green, or blue). The y-axis (vertical) shows the frequency of these pixel intensities.
From this histogram, we can infer a few things about the image:
The spikes at the far right end of each color indicate a large presence of bright pixels for that color. This observation confirms that the image is quite bright, providing a clear understanding of the image’s brightness.
The red and green channels have many pixels in the high-intensity region, whereas the blue spectrum remains primarily low. This means the image has shades of red and green but not much blue.
Applications of Color Histograms in Image Retrieval
Color histograms find widespread applications across various domains.
Image Retrieval: Color histograms, a type of image histograms, enable efficient searching and matching of images based on color similarity. Histograms between the reference and stored images are compared to retrieve the closest matching results.
Color Correction: Image histograms are valuable tools for adjusting color balance and enhancing image quality. They allow creatives to tweak pixel intensities to improve visibility and create a better-looking image.
Object Recognition: Image histograms have a minimal application in object recognition. A histogram is calculated and compared against histograms of various reference objects for a given image. Whichever returns a close match is said to be present within the search image.
Advanced Techniques in RGB Color Space Analysis
Beyond basic histogram generation, an image histogram visualizes the distribution of pixel intensities or colors in an image. Advanced techniques such as histogram equalization, matching, and back projection further enhance the capabilities of color analysis. Let’s discuss these in detail.
Histogram Equalization
Histogram equalization is an image processing technique that improves image contrast by adjusting the pixel intensities. It is popularly used in medical imaging, particularly in enhancing X-ray images. By redistributing pixel intensities, histogram equalization improves the contrast of X-ray images, making it easier for radiologists to detect subtle anomalies such as fractures or tumors, thus aiding in accurate diagnosis and treatment planning. Histogram equalization can be applied to a grayscale histogram to improve image contrast by visualizing pixel distribution across different brightness levels.
Histogram Matching
In the film industry, histogram matching plays a crucial role in color grading. This technique allows colorists to apply the color tone of a reference image or scene to others, ensuring visual consistency across different shots. For instance, a scene that evokes a warm sunset atmosphere can have its color histogram matched to a reference photo of an actual sunset, seamlessly conveying the desired mood and time of day. Histogram matching involves comparing the color histogram of a reference image to the original image to ensure visual consistency.
Backprojection in Object Tracking
Backprojection is instrumental in real-time object tracking, such as in sports broadcasting, where a specific player is tracked throughout the game. By using the color histogram of the player’s uniform, the system can continuously locate and highlight the player on the screen, even in fast-moving and crowded scenarios. Grayscale histograms can also be used in object tracking to analyze pixel intensity distributions, providing valuable insights for more accurate tracking. This enriches the viewing experience by allowing fans to easily follow their favorite athlete’s performance.
Color analysis and image analysis with vector database
In many modern approaches, vector databases have replaced histograms for image analysis. The image components, such as the color space details (RGB values), can be mapped to vectors and stored in high-performance vector databases like Zilliz. Pixel color values are stored in an image array format that can be reshaped for efficient comparison.
The stored features can benefit from the vector structure, such as efficient indexing and fast retrieval. The vector structure also allows embedding additional information like image metadata and can handle higher dimensional data.
Challenges and Considerations
Despite their utility, color histograms and image histograms pose distinct challenges, particularly in dealing with high-dimensional data and selecting appropriate color spaces. The curse of dimensionality may arise when analyzing histograms of images with many pixels or color channels, necessitating efficient data representation and processing techniques. Downscaling images is preferable, using modern algorithms to preserve color consistency and pixel features.
Moreover, the choice of color space can significantly impact the effectiveness of histogram-based analysis. Careful consideration of the color space can determine whether to process the data pre- or post-processing based on the specific task at hand.
Final Thoughts on Color Histograms
Mastering color histograms is indispensable for anyone involved in image processing and analysis. By understanding the nuances of color distributions and leveraging advanced techniques, practitioners can unlock the full potential of color histograms in various imaging projects and research endeavors. As we explore image processing and computer vision space, color histograms can advance our understanding and application of visual data.
In this guide, we have navigated the intricacies of color histograms, from their fundamental principles to their advanced applications, providing practical examples and code snippets.
- **What is a Color Histogram?**
- Generating Color Histograms from Input Image
- Applications of Color Histograms in Image Retrieval
- Advanced Techniques in RGB Color Space Analysis
- **Challenges and Considerations**
- **Final Thoughts on Color Histograms**
Content
Start Free, Scale Easily
Try the fully-managed vector database built for your GenAI applications.
Try Zilliz Cloud for FreeKeep Reading

Data Modeling Techniques Optimized for Vector Databases
This post explores various data modeling techniques for optimizing the performance of vector databases.

Understanding Regularization in Neural Networks
Regularization prevents a machine-learning model from overfitting during the training process. We'll discuss its concept and key regularization techniques.

What is Object Detection? A Comprehensive Guide
Object detection is a computer vision technique that uses neural networks to classify and locate objects, such as humans, buildings, or cars, in images or video.
