What is a Knowledge Graph (KG)?
A knowledge graph is a data structure representing information as a network of entities and their relationships.
Read the entire series
- What is Information Retrieval?
- Information Retrieval Metrics
- Search Still Matters: Enhancing Information Retrieval with Generative AI and Vector Databases
- Hybrid Search: Combining Text and Image for Enhanced Search Capabilities
- What Are Rerankers and How Do They Enhance Information Retrieval?
- Understanding Boolean Retrieval Models in Information Retrieval
- Will A GenAI Like ChatGPT Replace Google Search?
- The Evolution of Search: From Traditional Keyword Matching to Vector Search and Generative AI
- What is a Knowledge Graph (KG)?
The Internet is an ocean of information that keeps growing with time. This fact has caused the data to increase in complexity and volume. Managing, interpreting, and deriving meaning from data is becoming increasingly challenging. Knowledge graphs (KGs) provide a structured approach to connecting and contextualizing data to address this challenge. They are semantic networks that represent entities and their relationships in a graphical format, focusing on the connections between different pieces of data.
Although the phrase “knowledge graph” appeared as early as the 1980s, it developed from semantic networks, ontology, the semantic web, and linked data. However, it gained popularity in 2012 when Google announced its Knowledge Graph project to improve the search results, followed by further announcements of knowledge graphs by other companies, including Amazon, Facebook, and Microsoft.
Since then, knowledge graphs have become important in different fields, from search engines and recommendation systems to artificial intelligence and data analytics. They provide a deeper understanding of relationships and context, which allows systems to make more informed decisions.
In this article, we will introduce you to knowledge graphs in more detail, their components, how they are built, and their different applications.
What is a Knowledge Graph (KG)?
A knowledge graph is a data structure representing information as a network of entities and their relationships. It is a directed labeled graph in which domain-specific meanings are linked with nodes and edges (relationships).
Knowledge graphs have three key components: Nodes (entities), Edges (relationships), and Labels.
A node can represent any real-world entity, including people, companies, and computers. An edge captures the relationship of interest between the two nodes, such as a customer relationship between a company and a person or a network connection between two computers. To improve the graph's clarity, labels provide additional information about the nodes and edges. They are the entities' attributes that specify the nature of the relationships.
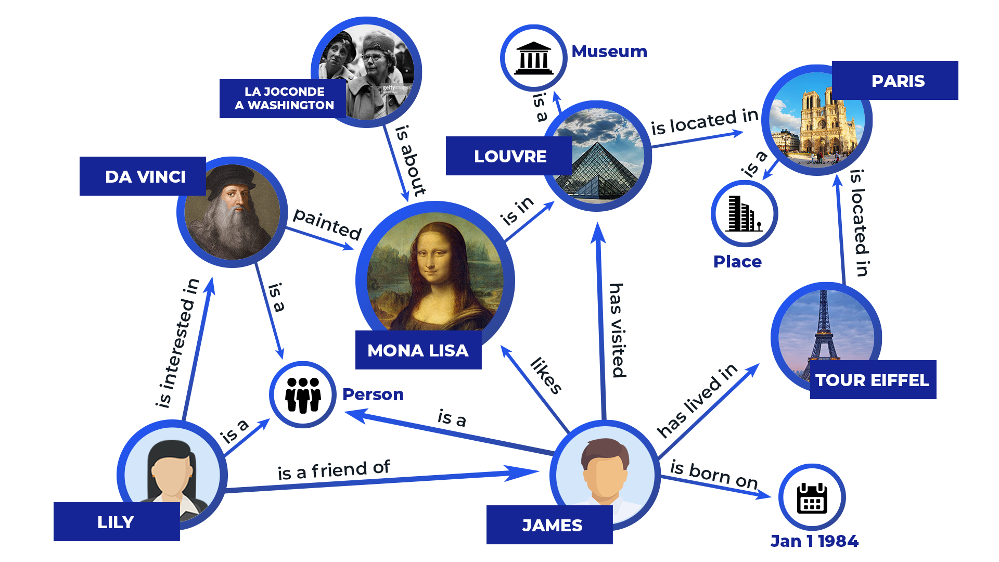 Figure 1 Knowledge graphs illustration.png
Figure 1: Knowledge graphs illustration (image source)
What sets knowledge graphs apart from other data structures, like tables in traditional databases, is their ability to handle complex, interlinked relationships between entities. Knowledge graphs are usually stored in a graph database like Neo4j and ArangoDB.
Knowledge graphs store data in a more dynamic and interconnected way. The following diagram shows how the data can be represented in a table and a graph. One of the benefits of a graph is that it offers schema flexibility, removing the limitation imposed by predefined “table headers.” As a result, a graph can evolve without causing any disruption to the data store.
 Figure 2 Data represented in the table and graph.png
Figure 2: Data represented in the table and graph
Core Characteristics of Knowledge Graphs
Knowledge graphs are structured datasets designed to capture the complex interconnections between entities and their relationships. They possess several key characteristics which make them valuable for different applications.
Interlinked descriptions of entities
Formal semantics and ontologies
Ability to integrate data from multiple sources
Scalability and flexibility
Interlinked Descriptions of Entities
Knowledge graphs don't just store isolated facts. They represent a collection of interlinked descriptions of entities. In a knowledge graph, each entity is represented as a node, such as people, whereas edges denote semantic links binding one entity to another. These connections create a network of information and provide a deeper understanding of the context and relationships between entities.
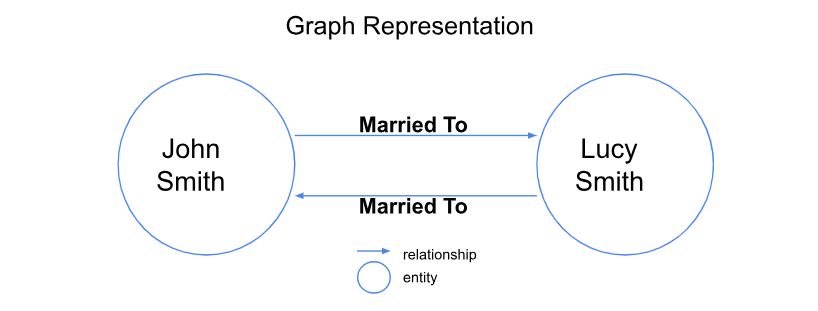 Figure 3 An example of Graph representation.png
Figure 3: An example of Graph representation (Image by the Author)
Formal Semantics and Ontologies
In the context of knowledge graphs, formal semantics and ontologies are important components that enable clear explanations and consistent data organization. Formal semantics refers to the use of well-defined rules to represent and reason about information, and knowledge graphs rely heavily on it, meaning they use predefined structures (ontology) to define the types of entities and relationships.
Ontologies typically consist of:
Classes define the types of entities in the knowledge graph, such as "Person," "Place," or "Event."
Properties describe the attributes of entities and the relationships between them. For example, a "Person" class might have properties like "Name," "Age," and "Address."
Instances: The actual data points in the knowledge graph represent specific classes.
Knowledge graphs can use ontologies to organize data in a consistent and structured manner, making it easier to analyze.
Ability to Integrate Data from Multiple Sources
Combining data from numerous sources can be complex. When we bring together structured data (like databases), semi-structured data (like XML files), and unstructured data (like text), it can get messy. Thankfully, knowledge graphs are highly flexible and excel at integrating these pieces into one clear picture. This is because they can represent entities and relationships in a format that mirrors human understanding and cognition.
For example, a knowledge graph can connect a movie database (structured data) with movie reviews from multiple websites (unstructured data) and ratings from different sources (semi-structured data). This integration creates a more comprehensive analysis and insights about each movie, including its cast, director, genre, ratings, and people's opinions.
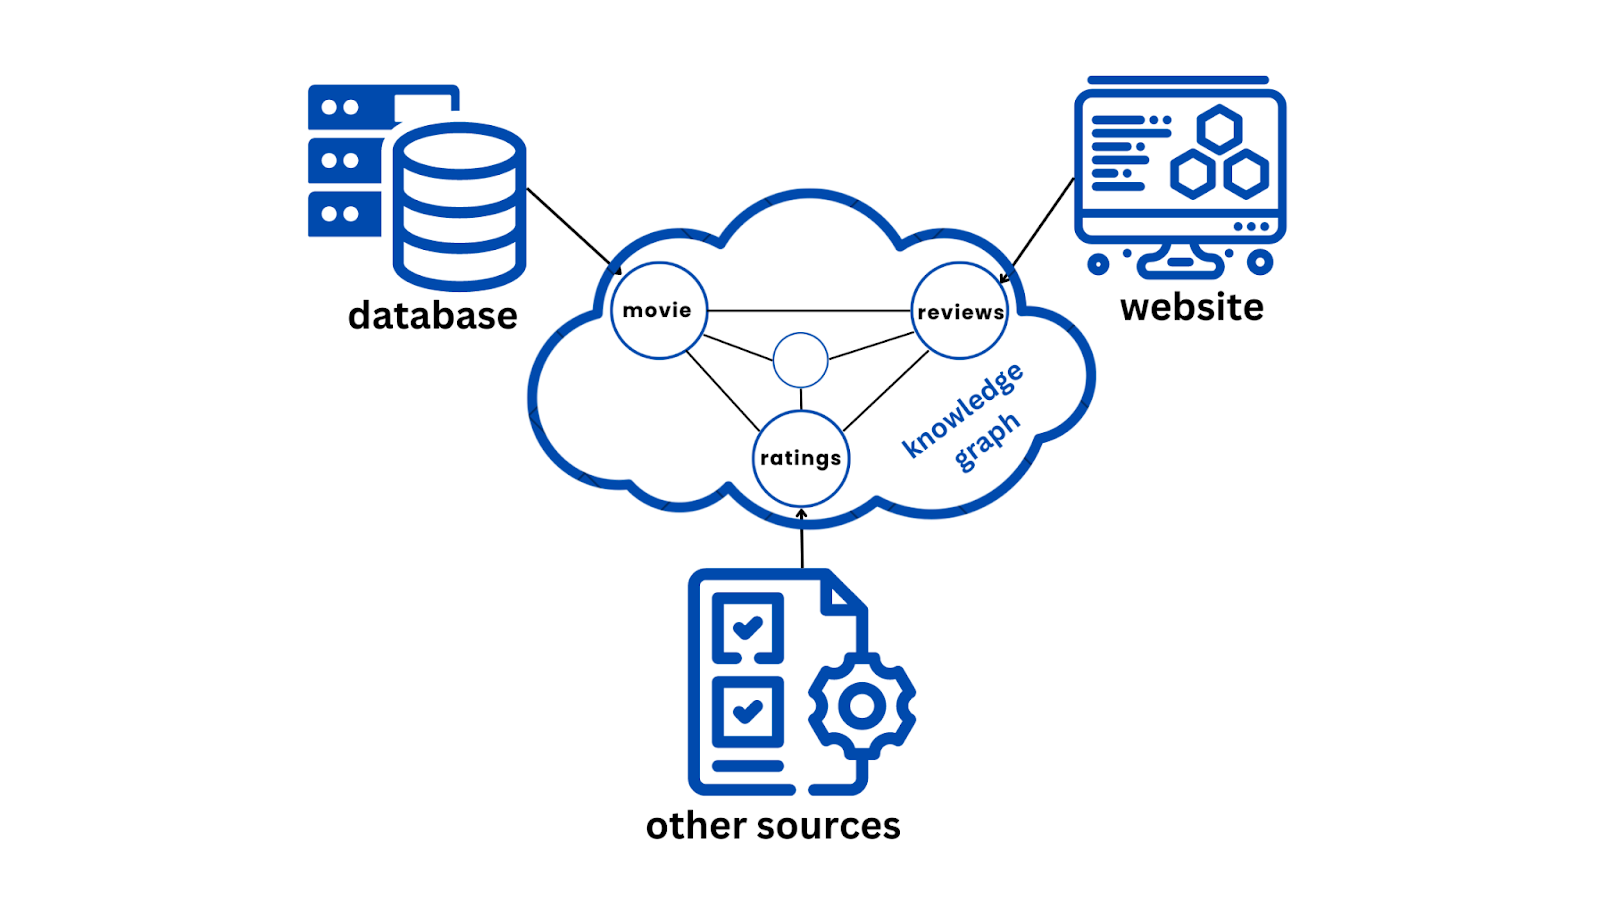 Figure 4 Data from multiple sources to KG.png
Figure 4: Data from multiple sources to KG
Scalability and Flexibility
Knowledge graphs are scalable and flexible. They are designed to handle the growth by efficiently managing more entities, relationships, and queries as the dataset grows.
Scalability can be achieved in two main ways:
Vertical Scalability: This involves increasing the capacity of a single system, such as by adding more memory. We can upgrade the database system that stores the graph to handle more data and complex queries.
Horizontal Scalability: This involves distributing the data across multiple systems. Knowledge graphs can be split across different machines, each handling a portion of the graph.
Due to their graph-based nature, knowledge graphs can easily expand to handle large amounts of data, allowing for easy data integration and modification.
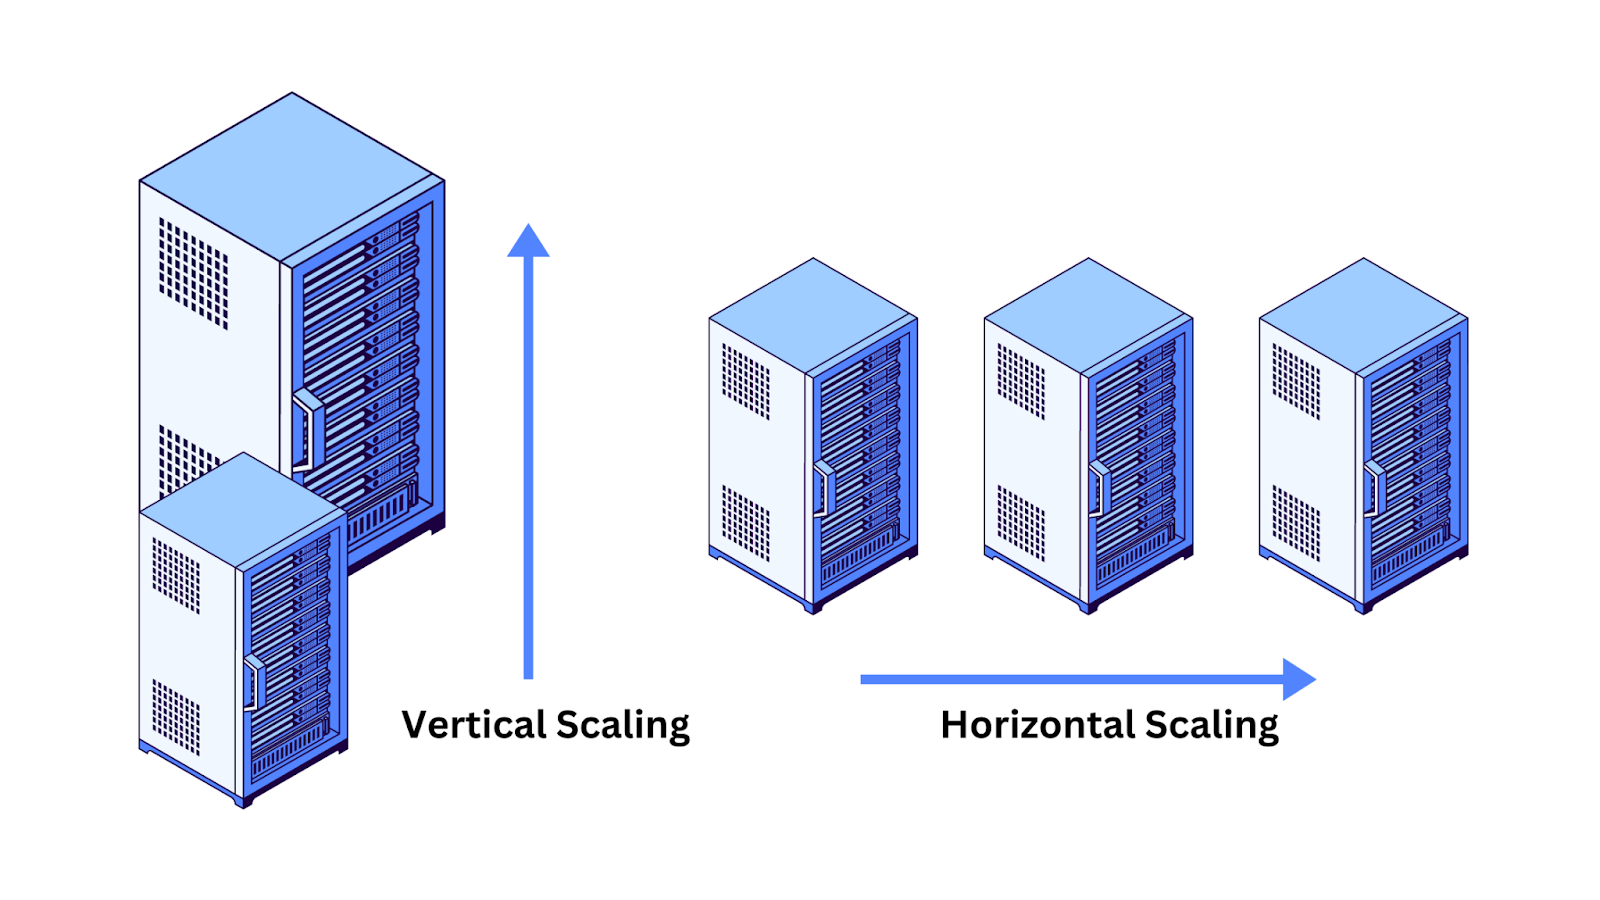 Figure 5 Vertical and horizontal scalability.png
Figure 5: Vertical and horizontal scalability
Knowledge Graphs vs Vector Embeddings
Knowledge graphs and vector embeddings are both data representations used in modern data systems, but they operate in fundamentally different ways.
Knowledge Graphs are structured representations where entities (such as people, organizations, or concepts) are nodes, and the relationships between these entities are edges. This creates a graph-like structure that visually and logically maps out how different pieces of information are interconnected. Knowledge graphs excel in scenarios requiring clear, interpretable relationships and reasoning over explicit connections. For example, a knowledge graph might show that "Albert Einstein" is connected to "Theory of Relativity" through the relationship "developed," providing a clear and understandable map of related concepts.
Vector embeddings, on the other hand, are numerical representations of data in a high-dimensional space, typically used to capture the semantic meaning of words, sentences, or even entire documents. Each entity or piece of information is converted into a vector, and the distance between these vectors reflects the semantic similarity. For instance, in a vector space, the words "king" and "queen" would be close together, reflecting their related meanings. Vector embeddings are particularly useful in handling unstructured data, like text or images, where the goal is to capture subtle, implicit relationships that aren't as easily defined as in a knowledge graph.
Knowledge graphs are typically stored in graph databases, while vector embeddings are stored in vector databases such as Milvus and Zilliz Cloud (the fully managed version of Milvus). With advancements in AI, especially large language models (LLMs), both vector and graph databases can be integrated, either separately or in combination, with LLMs to build powerful Retrieval Augmented Generation (RAG) applications.
To explore how you can leverage knowledge graphs and vector embeddings to create more advanced RAG applications, check out these resources:
You can also watch this video tutorial to learn how to integrate knowledge graphs into RAG.
Key Considerations of Building a Knowledge Graph
Building a knowledge graph is a complex process that involves gathering, processing, and integrating data from different sources to create a structured representation of knowledge. There are some key steps involved in the process.
Data sources
Extraction techniques
Integration and fusion
Data Sources
The foundation of any knowledge graph is the data that populates it. Data can come from different sources, each with its structure and format. Understanding these different data sources is important for building a robust knowledge graph.
Structured Data: Structured data is information organized into a predefined format, often stored in relational databases or spreadsheets. It is highly organized, with clear relationships between different pieces of information.
Unstructured Data: Unstructured data lacks a predefined structure. It is mainly found in the form of text, images, or videos. Working with this data type is difficult because it doesn’t fit neatly into tables or relational databases.
Semi-structured Data: Semi-structured data falls between structured and unstructured data. It is sometimes in structured form and sometimes in unstructured form. JSON file is a good example of semi-structured data that stores product information with keys like "Name," "Price," and "Description," where the "Description" field contains free-form text.
Extraction Techniques
After selecting the relevant data sources, the next step is to extract the necessary information to populate the knowledge graph. We can extract this information using different techniques to identify entities (the nodes in the graph) and the relationships between them (the edges).
Natural Language Processing (NLP) techniques: Extract information from text data. These techniques build a knowledge graph by processing unstructured text and identifying entities and relationships between those entities.
Machine Learning Approaches: Machine learning can also be used to automate the extraction of information from data. Machine learning algorithms can learn to spot patterns and relationships in new data by training models on labeled datasets.
Integration and Fusion
The next step is integrating this data into a knowledge graph. This process involves different techniques, including entity resolution and data cleaning.
Entity Resolution: Entity resolution finds and merges duplicate entities within the knowledge graph. When data comes from multiple sources, it's common for the same entity (person or place) to be represented differently. Entity resolution techniques, such as probabilistic matching, rule-based matching, and machine learning approaches, find and link equivalent entities. Entity resolution ensures all references to the same entity are linked to a single node in the knowledge graph.
Data Cleaning and Normalization: It's important to clean and normalize the data before integrating it into the knowledge graph. Data cleaning involves correcting errors, removing duplicates, and dealing with missing or inconsistent information. Techniques like sentence segmentation, speech tagging, and named entity recognition can be used to identify and correct errors in text data. In normalization, we convert data into a standard format easily integrated into the knowledge graph.
Building Knowledge Graphs Using NLP
In the following sections, we will use NLP techniques such as sentence segmentation, dependency parsing, parts-of-speech tagging, and entity recognition to build a knowledge graph from the text. The dataset and the code used in this article are available on Kaggle.
Import Dependencies & Load Dataset
import re
import pandas as pd
import bs4
import requests
import spacy
from spacy import displacy
nlp = spacy.load('en_core_web_sm')
from spacy.matcher import Matcher
from spacy.tokens import Span
import networkx as nx
import matplotlib.pyplot as plt
from tqdm import tqdm
pd.set_option('display.max_colwidth', 200)
%matplotlib inline
# import wikipedia sentences
candidate_sentences = pd.read_csv("../input/wiki-sentences/wiki_sentences_v2.csv")
Candidate_sentences.shape
Sentence Segmentation
The first step in building a knowledge graph is to split the text document into sentences. Then, we will shortlist only those split sentences with exactly one subject and one object.
doc = nlp("the drawdown process is governed by astm standard d823")
for tok in doc:
  print(tok.text, "...", tok.dep_)
Entities Extraction
The extraction of a single-word entity from a sentence is simple. Parts of speech (POS) tags make it simple to accomplish this task. Our entities would be the nouns and proper nouns. However, POS tags are inadequate when an entity spans more than one word. The sentence's dependency tree needs to be parsed. When creating a knowledge graph, the nodes and the edges connecting them are the most crucial components.
These nodes will be the entities present in the Wikipedia sentences. The connections that bind these items together are called edges. We will extract these elements in an unsupervised manner, i.e., using the grammar of the sentences.
def get_entities(sent):
  ent1 = ""
  ent2 = ""
  prv_tok_dep = ""    # dependency tag of previous token in the sentence
  prv_tok_text = ""   # previous token in the sentence
  prefix = ""
  modifier = ""

  for tok in nlp(sent):
    # if token is a punctuation mark then move on to the next token
    if tok.dep_ != "punct":
      # check: token is a compound word or not
      if tok.dep_ == "compound":
        prefix = tok.text
        # if the previous word was also a 'compound' then add the current word to it
        if prv_tok_dep == "compound":
          prefix = prv_tok_text + " "+ tok.text

      # check: token is a modifier or not
      if tok.dep_.endswith("mod") == True:
        modifier = tok.text
        # if the previous word was also a 'compound' then add the current word to it
        if prv_tok_dep == "compound":
          modifier = prv_tok_text + " "+ tok.text

      if tok.dep_.find("subj") == True:
        ent1 = modifier +" "+ prefix + " "+ tok.text
        prefix = ""
        modifier = ""
        prv_tok_dep = ""
        prv_tok_text = ""
      if tok.dep_.find("obj") == True:
        ent2 = modifier +" "+ prefix +" "+ tok.text
      # update variables
      prv_tok_dep = tok.dep_
      prv_tok_text = tok.text
return [ent1.strip(), ent2.strip()]
get_entities("the film had 200 patents")
entity_pairs = []
for i in tqdm(candidate_sentences["sentence"]):
  entity_pairs.append(get_entities(i))
entity_pairs[10:20]
Output
Figure 7: the output of entity extraction (Image by Author)
As you can see, these entity pairings contain a few pronouns, such as "she," "we," "it," etc. Instead, we would like proper nouns or nouns. We could enhance the get_entities() function to exclude pronouns.
Relations Extraction
Entity extraction is half the job done. To build a knowledge graph, we need edges (relationships) to connect the nodes (entities). These edges are the relationships between a pair of nodes. Such predicates can be extracted from the sentences via the function below. Here, we have used SpaCy’s rule-based matching.
def get_relation(sent):
  doc = nlp(sent)
  # Matcher class object
  matcher = Matcher(nlp.vocab)
  #define the pattern
  pattern = [{'DEP':'ROOT'},
            {'DEP':'prep','OP':"?"},
            {'DEP':'agent','OP':"?"},
            {'POS':'ADJ','OP':"?"}]
  matcher.add("matching_1", None, pattern)
  matches = matcher(doc)
  k = len(matches) - 1
  span = doc[matches[k][1]:matches[k][2]]
return(span.text)
get_relation("John completed the task")
relations = [get_relation(i) for i in tqdm(candidate_sentences['sentence'])]
Create a Knowledge Graph
We will create a knowledge graph via the extracted entities (subject-object pairs) and the predicates (relation between entities).
Let’s form a data frame of entities and predicates:
# extract subject
source = [i[0] for i in entity_pairs]
# extract object
target = [i[1] for i in entity_pairs]
kg_df = pd.DataFrame({'source':source, 'target':target, 'edge':relations})
Next, we will use the networkx library to create a network from this data frame. In this network, the nodes signify the entities, while the edges or links between them illustrate their relationships.
This will be a directed graph, meaning the connection between any pair of nodes is one-way. The relationship flows from one node to the other, not both ways.
# create a directed-graph from a dataframe
G=nx.from_pandas_edgelist(kg_df, "source", "target",
                          edge_attr=True, create_using=nx.MultiDiGraph())
Let’s plot the network.
plt.figure(figsize=(12,12))
pos = nx.spring_layout(G)
nx.draw(G, with_labels=True, node_color='skyblue', edge_cmap=plt.cm.Blues, pos = pos)
plt.show()
Output
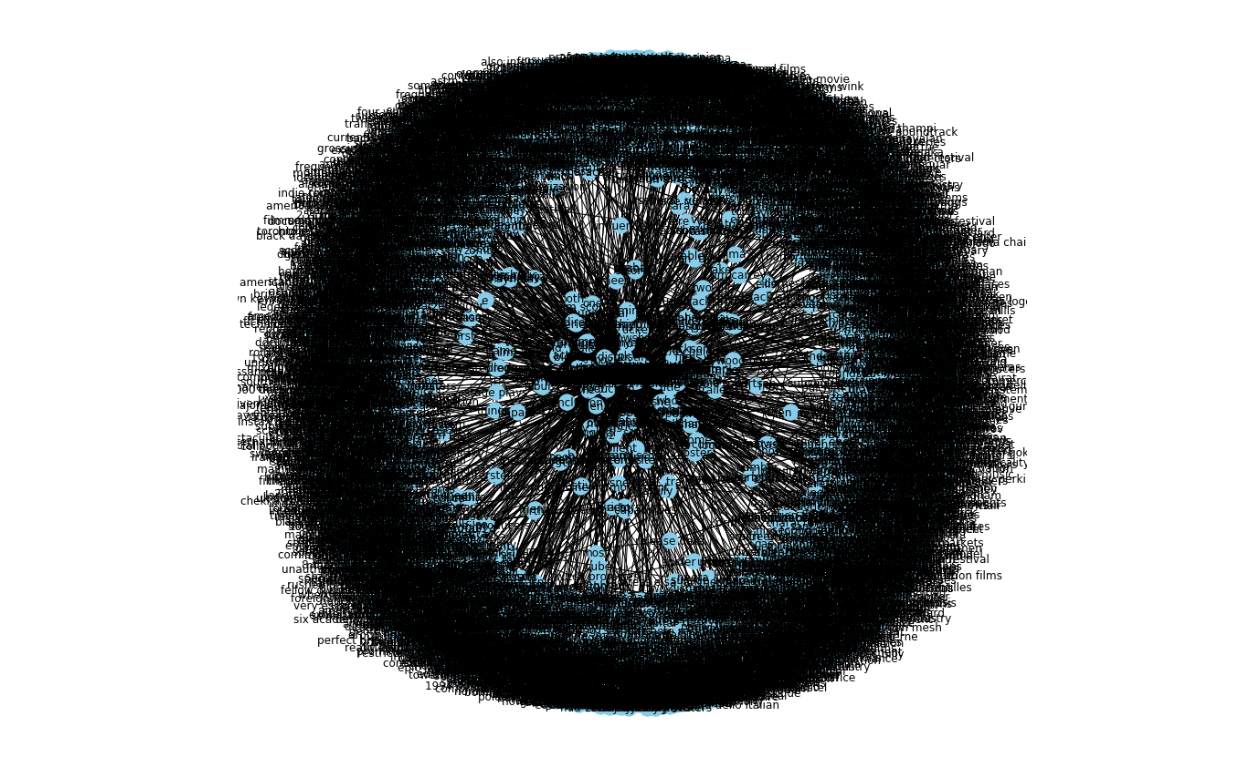 Figure 6 KG with all the relations.png
Figure 6: KG with all the relations
The resulting graph, shown above, was created with all the relations that we had. It becomes difficult to visualize a graph with excessive relations or predicates.
So, it’s best to use only a few important relations to visualize a graph. Now, let's take one relationship at a time. Let’s start with the relation “composed by”:
G=nx.from_pandas_edgelist(kg_df[kg_df['edge']=="composed by"], "source", "target",
                          edge_attr=True, create_using=nx.MultiDiGraph())
plt.figure(figsize=(12,12))
pos = nx.spring_layout(G, k = 0.5) # k regulates the distance between nodes
nx.draw(G, with_labels=True, node_color='skyblue', node_size=1500, edge_cmap=plt.cm.Blues, pos = pos)
plt.show()
Output
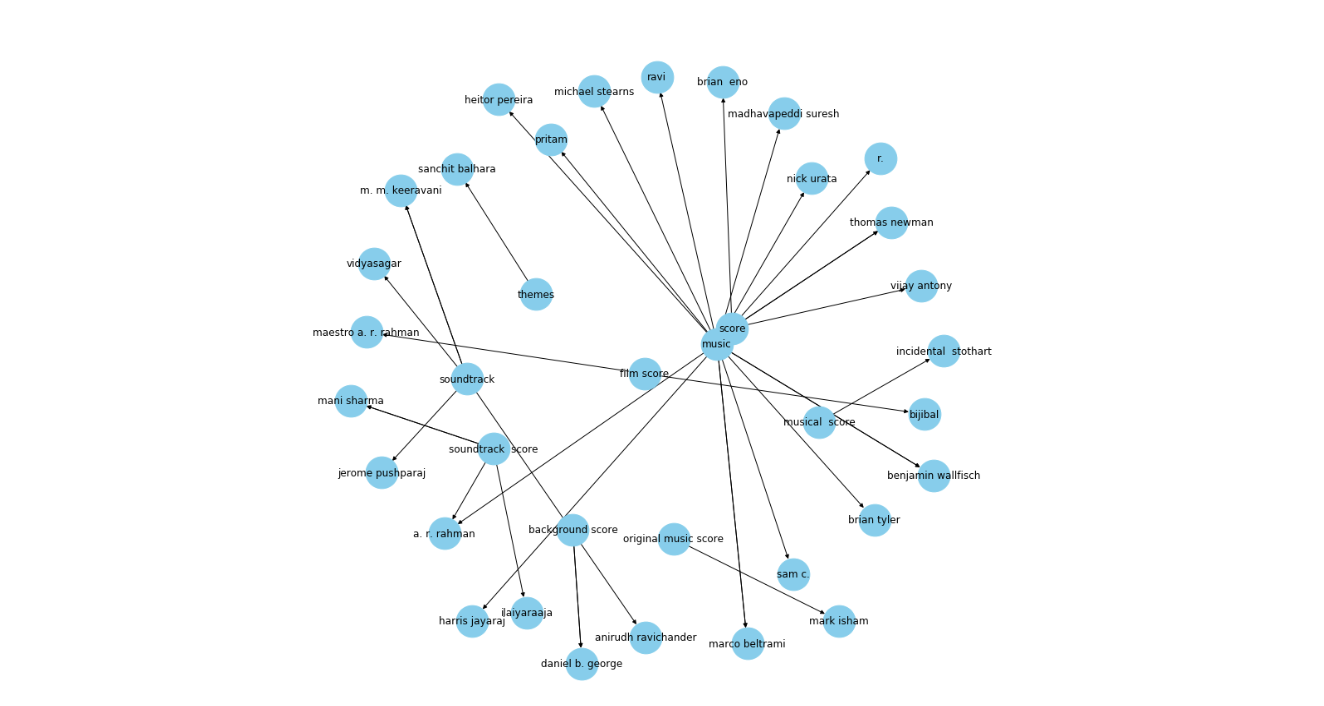 Figure 7 KG with one relation.png
Figure 7: KG with one relation
The output reveals a much cleaner graph. Here, the arrows point towards the composers. For instance, Daniel b. George has entities like “background score” and “soundtrack” connected to him in the graph above.
Let’s check out a few more relations. Now, we will visualize the graph for the “written by” relation:
G=nx.from_pandas_edgelist(kg_df[kg_df['edge']=="written by"], "source", "target",
                          edge_attr=True, create_using=nx.MultiDiGraph())
plt.figure(figsize=(12,12))
pos = nx.spring_layout(G, k = 0.5)
nx.draw(G, with_labels=True, node_color='skyblue', node_size=1500, edge_cmap=plt.cm.Blues, pos = pos)
plt.show()
Output
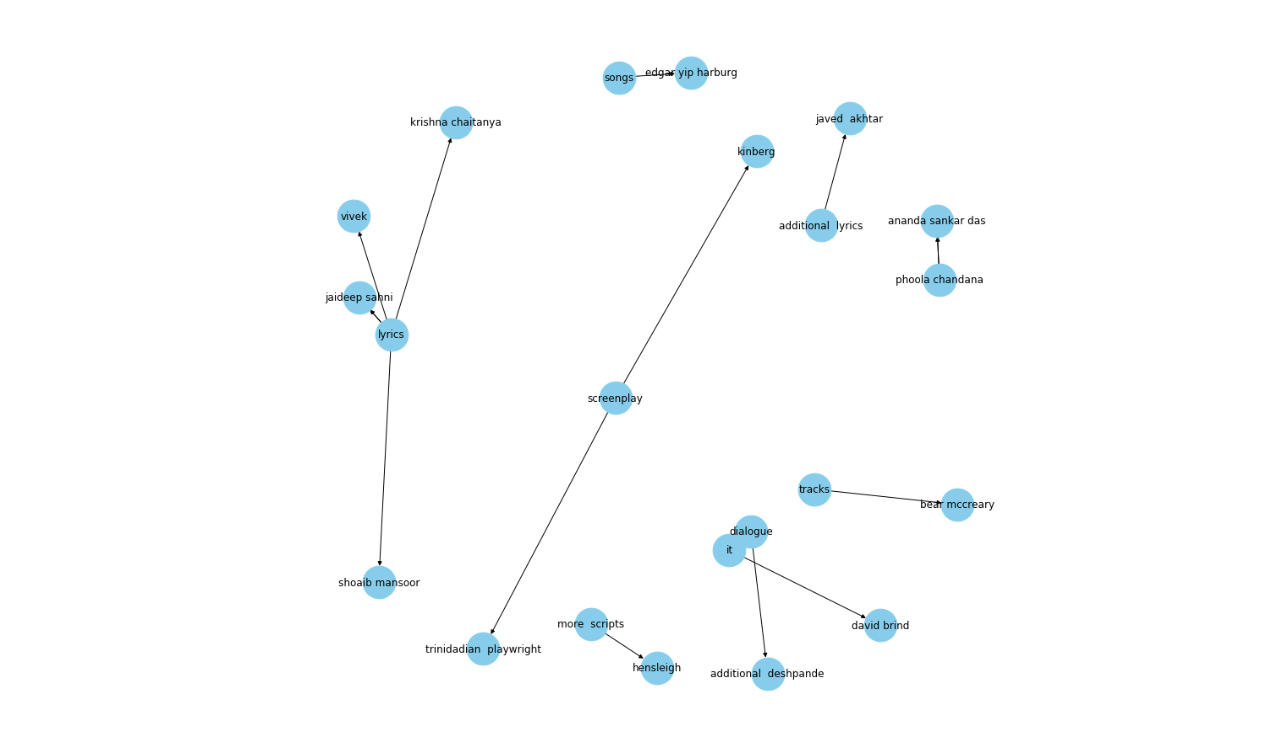 Figure 8 KG with one relation.png
Figure 8: KG with one relation
This knowledge graph provides exceptional insights and beautifully illustrates the connections between renowned lyricists.
Let’s see the knowledge graph of another important predicate, i.e., the “released in”:
G=nx.from_pandas_edgelist(kg_df[kg_df['edge']=="released in"], "source", "target",
                          edge_attr=True, create_using=nx.MultiDiGraph())
plt.figure(figsize=(12,12))
pos = nx.spring_layout(G, k = 0.5)
nx.draw(G, with_labels=True, node_color='skyblue', node_size=1500, edge_cmap=plt.cm.Blues, pos = pos)
plt.show()
Output
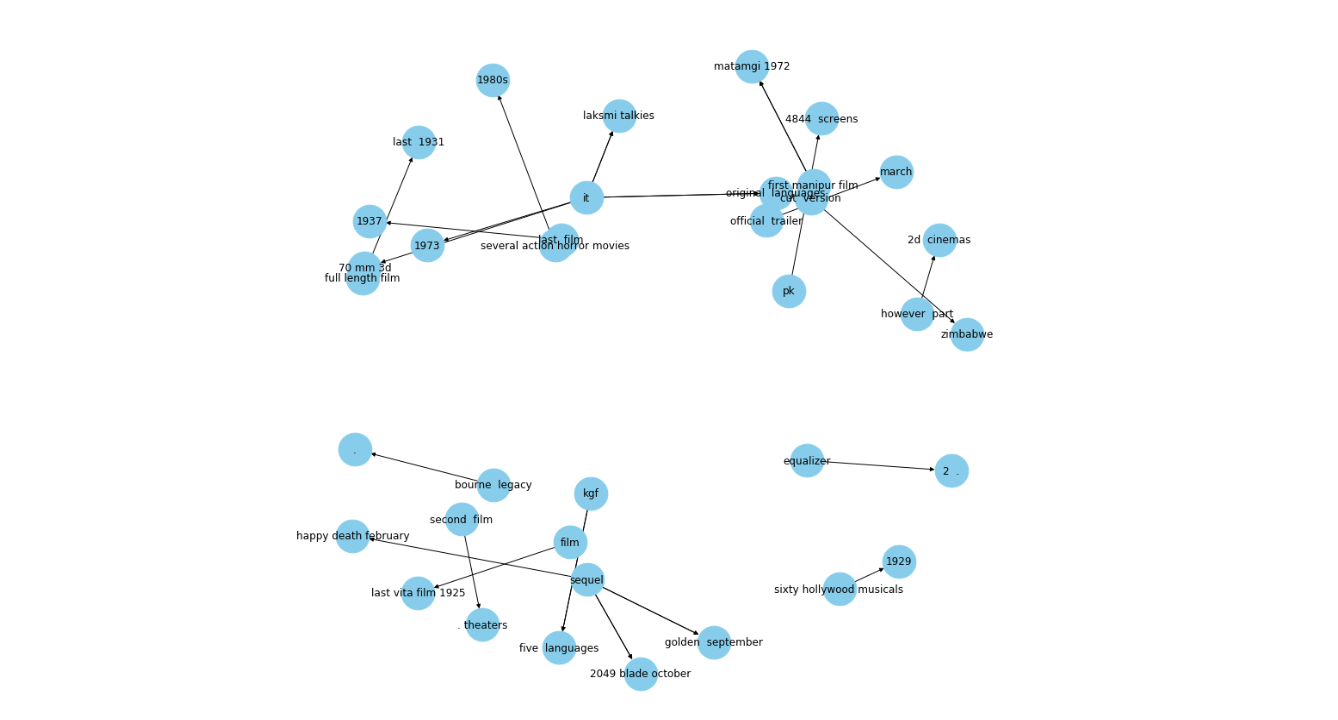 Figure 9 KG with one relation.png
Figure 9: KG with one relation
This knowledge graph represents entities like dates or movies, with the lines representing their release dates "released in." Now, let's look at some of the important applications of knowledge graphs.
Applications of Knowledge Graphs
Knowledge graphs have a wide range of applications across different industries due to their ability to represent and connect information meaningfully. Let's look at how they are being used in some key areas.
Search Engines
One of the most popular applications of knowledge graphs is in search engines. They allow search engines to go beyond simple keyword matching, understand the context behind a user's query, and provide more comprehensive and informative search results. The two most popular search engine knowledge graphs today include Google knowledge graphs and Microsoft's Bing knowledge graph.
Google's Knowledge Graph: In 2012, Google introduced its Knowledge Graph, which changed how search results are delivered. The knowledge graph allowed Google to understand the relationships between different entities and provide more relevant information.
Semantic Search Capabilities: Traditional search engines rely on keyword matching to return search results, which can lead to irrelevant results. With the help of a knowledge graph, search engines can understand the semantic meaning behind a user's query and provide more accurate results.
Recommendation Systems
Knowledge graphs have long-powered recommendation systems. Popular streaming services like Netflix or Spotify use knowledge graphs to recommend content to users. These graphs capture the interconnected information and relationships between different entities, such as movies, actors, and user preferences. By analyzing this information, the system can identify patterns and provide more personalized recommendations.
Question Answering Systems
Virtual assistants and chatbots also use knowledge graphs to answer user queries accurately. Using KG virtual assistants, interpret queries by understanding the relationships between the entities mentioned in the query and responding appropriately. For example, if a user asks about the director of the latest James Bond movie, the assistant uses KG to identify the "James Bond" entity. Next, it finds the most recent movie and determines the director.
Business Intelligence
Business intelligence (BI) systems use knowledge graphs to integrate and analyze data from different sources. This allows organizations to find patterns, trends, and relationships within their data and make data-driven decisions that improve efficiency and drive business success.
Knowledge Graph Benefits
Knowledge graphs have many benefits, including:
Improved Data Contextualization: Knowledge graphs connect related information, making it easier to see how things are related and understand the bigger picture.
Enhanced Data Discovery: A knowledge graph makes it easy to explore complex data, identify trends, find new insights, and make connections that might not be obvious at first.
Better Decision-making Support: Knowledge graphs help organizations innovate, identify new opportunities, and make evidence-based decisions by identifying trends and relationships in data.
Flexibility and Scalability: Knowledge graphs can grow and change with your data, making them perfect for environments where information is constantly updated.
Knowledge Graph Challenges
Besides the advantages, knowledge graphs also come with challenges:
Data Quality and Consistency: It might be challenging to ensure that the information in a knowledge graph is correct and consistent, especially when combining data from multiple sources.
Scalability for Large-Scale Graphs: As knowledge graphs grow, they can become more challenging to manage and maintain, particularly in terms of performance and storage.
Maintenance and Updates: Keeping a knowledge graph up to date requires ongoing effort, as new information must be continuously integrated, and old information may need to be revised.
Privacy and Security Concerns: When sensitive information is included, privacy and security become major concerns. It's important to protect the data and control who has access to it.
Future Trends
As knowledge graph technology advances, we can expect its integration with new tools and applications to help us understand complex information. Let's see some of the key future trends:
Integration with AI and Machine Learning
As industries increasingly adopt machine learning, knowledge graph technology will likely evolve hand-in-hand. In addition to being a useful format for feeding training data to algorithms, machine learning can quickly build and structure graph databases, drawing connections between the data points. This integration allows for more advanced applications like predictive analytics and automated decision-making.
Furthermore, with the rise of technology, we can now store structure and semantic meaning as vector embeddings in knowledge graphs. This involves converting entities and relationships into vector representations that can be used in machine learning models. This technique helps improve the accuracy of predictions and recommendations.
Decentralized Knowledge Graphs
Decentralized knowledge graphs are a concept inspired by blockchain technology. As blockchain continues to grow, there is growing interest in decentralizing knowledge graphs, where data is hosted on an open data structure rather than being controlled by a single central authority.
Multimodal Knowledge Graphs
Multimodal knowledge graphs extend the traditional concept of knowledge graphs by adding different data types, such as images, videos, and audio. Effective data management and use have made KG an important topic in development. By integrating different data types, multimodal knowledge graphs can provide a more informative representation of entities and relationships.
Conclusion
Knowledge graphs have become important in today's fast-growing digital world. They provide a structured and interconnected representation of information. Knowledge graphs help us organize, connect, and make sense of large amounts of data by representing entities and their relationships as a network.
Knowledge graphs' ability to evolve, scale, and adapt to new information makes them valuable for applications such as search engines, virtual personal assistants, and recommendations. However, privacy and security concerns must be addressed, and scalable solutions must be developed to handle the demands of large-scale graphs.
Further Resources
- What is a Knowledge Graph (KG)?
- Core Characteristics of Knowledge Graphs
- Knowledge Graphs vs Vector Embeddings
- Key Considerations of Building a Knowledge Graph
- Building Knowledge Graphs Using NLP
- Applications of Knowledge Graphs
- Knowledge Graph Benefits
- Knowledge Graph Challenges
- Future Trends
- Conclusion
- Further Resources
Content
Start Free, Scale Easily
Try the fully-managed vector database built for your GenAI applications.
Try Zilliz Cloud for FreeKeep Reading
What is Information Retrieval?
Information retrieval (IR) is the process of efficiently retrieving relevant information from large collections of unstructured or semi-structured data.

Search Still Matters: Enhancing Information Retrieval with Generative AI and Vector Databases
Despite advances in LLMs like ChatGPT, search still matters. Combining GenAI with search and vector databases enhances search accuracy and experience.
The Evolution of Search: From Traditional Keyword Matching to Vector Search and Generative AI
Explores the evolution of search, the limitations of keyword-matching systems, and how vector search and GenAI are setting new standards for modern search.
