How to Spot Search Performance Bottleneck in Vector Databases
Learn how to monitor search performance, spot bottlenecks, and optimize the performance in a vector database like Milvus.
Read the entire series
- Introduction to Unstructured Data
- What is a Vector Database and how does it work: Implementation, Optimization & Scaling for Production Applications
- Understanding Vector Databases: Compare Vector Databases, Vector Search Libraries, and Vector Search Plugins
- Introduction to Milvus Vector Database
- Milvus Quickstart: Install Milvus Vector Database in 5 Minutes
- Introduction to Vector Similarity Search
- Everything You Need to Know about Vector Index Basics
- Scalar Quantization and Product Quantization
- Hierarchical Navigable Small Worlds (HNSW)
- Approximate Nearest Neighbors Oh Yeah (Annoy)
- Choosing the Right Vector Index for Your Project
- DiskANN and the Vamana Algorithm
- Safeguard Data Integrity: Backup and Recovery in Vector Databases
- Dense Vectors in AI: Maximizing Data Potential in Machine Learning
- Integrating Vector Databases with Cloud Computing: A Strategic Solution to Modern Data Challenges
- A Beginner's Guide to Implementing Vector Databases
- Maintaining Data Integrity in Vector Databases
- From Rows and Columns to Vectors: The Evolutionary Journey of Database Technologies
- Decoding Softmax Activation Function
- Harnessing Product Quantization for Memory Efficiency in Vector Databases
- How to Spot Search Performance Bottleneck in Vector Databases
- Ensuring High Availability of Vector Databases
- Mastering Locality Sensitive Hashing: A Comprehensive Tutorial and Use Cases
- Vector Library vs Vector Database: Which One is Right for You?
- Maximizing GPT 4.x's Potential Through Fine-Tuning Techniques
- Deploying Vector Databases in Multi-Cloud Environments
- An Introduction to Vector Embeddings: What They Are and How to Use Them
Imagine you have a powerful computer system or an application designed to perform tasks at lightning speed. But there's a hitch – one of its components isn't keeping up with the rest. This underperforming part limits the system's overall capacity, just like the bottle's narrow neck restricts the liquid flow. In software, the bottleneck is the component with the lowest throughput in the entire transaction path. If one cog in the machine is not spinning as fast as the others, everything will slow down. This concept is crucial because identifying and fixing bottlenecks can dramatically improve the efficiency of computer systems and applications.
In my previous blog, we introduced key metrics and benchmarking tools for evaluating different vector databases before you make a decision. In this post, we’ll take the Milvus vector database as an example, particularly Milvus 2.2 and later versions, and cover how to monitor search performance, spot bottlenecks, and optimize the performance in a vector database.
Performance Evaluation and Monitoring Metrics
In vector database systems, three frequently used and most important evaluation metrics are Recall, Latency, and Queries Per Second (QPS). They describe how accurate, how fast, and how many requests the system can handle. Let's explore them in detail.
Recall
As defined by Wikipedia, recall is the proportion of relevant items successfully retrieved in a search query. It assesses how many of the closest Top-K vectors to a given query vector are retrieved. However, not all close vectors may be identified. This shortfall often arises because indexing algorithms, except for the Brute Force method, are approximate. These algorithms trade off recall for increased speed. The configuration of these indexing algorithms aims to strike a balance tailored to specific production needs. For detailed information, see our documentation pages: In-memory Index and On-disk Index.
Calculating recall can be resource-intensive, usually performed by the client side, and is not typically reflected in your monitoring dashboards due to the extensive computation required to establish the ground truth. Therefore, in the following step-by-step guide, we assume that an acceptable recall level has been achieved and appropriate index parameters have been selected for the vector index.
Latency
Latency is about response speed – the time taken from query initiation to receiving a result as the water flows from one end to another. Lower latency ensures faster responses, which is crucial for real-time applications.
QPS
Queries Per Second (QPS) is a crucial metric that measures the system's throughput, indicating how many queries it can handle per second, much like the water flow rate through a pipe. A higher QPS value signifies a system's enhanced capability to manage numerous concurrent requests, a key factor in system performance.
The relationship between QPS and latency is often complex. In traditional database systems, latency generally increases as QPS approaches the system's capacity and consumes all its resources. However, in the case of Milvus, the system optimizes performance by batching queries together. This approach reduces network packet sizes and can lead to concurrent increases in both latency and QPS, improving overall system efficiency.
Performance Monitoring Tools
We’ll use Prometheus to collect and analyze Milvus's performance results and a Grafana dashboard to visualize and help us identify performance bottlenecks.
How to Find Performance Bottlenecks: A Step-by-Step Guide
The flowchart outlines a streamlined approach to effectively identifying performance bottlenecks using Grafana. Yellow diamonds and boxes indicate decision points where conditions must be evaluated, while light blue boxes suggest specific actions or provide direction to more detailed information. In the upcoming sections, we will guide you through each step to monitor and detect performance issues, as depicted in the flowchart.
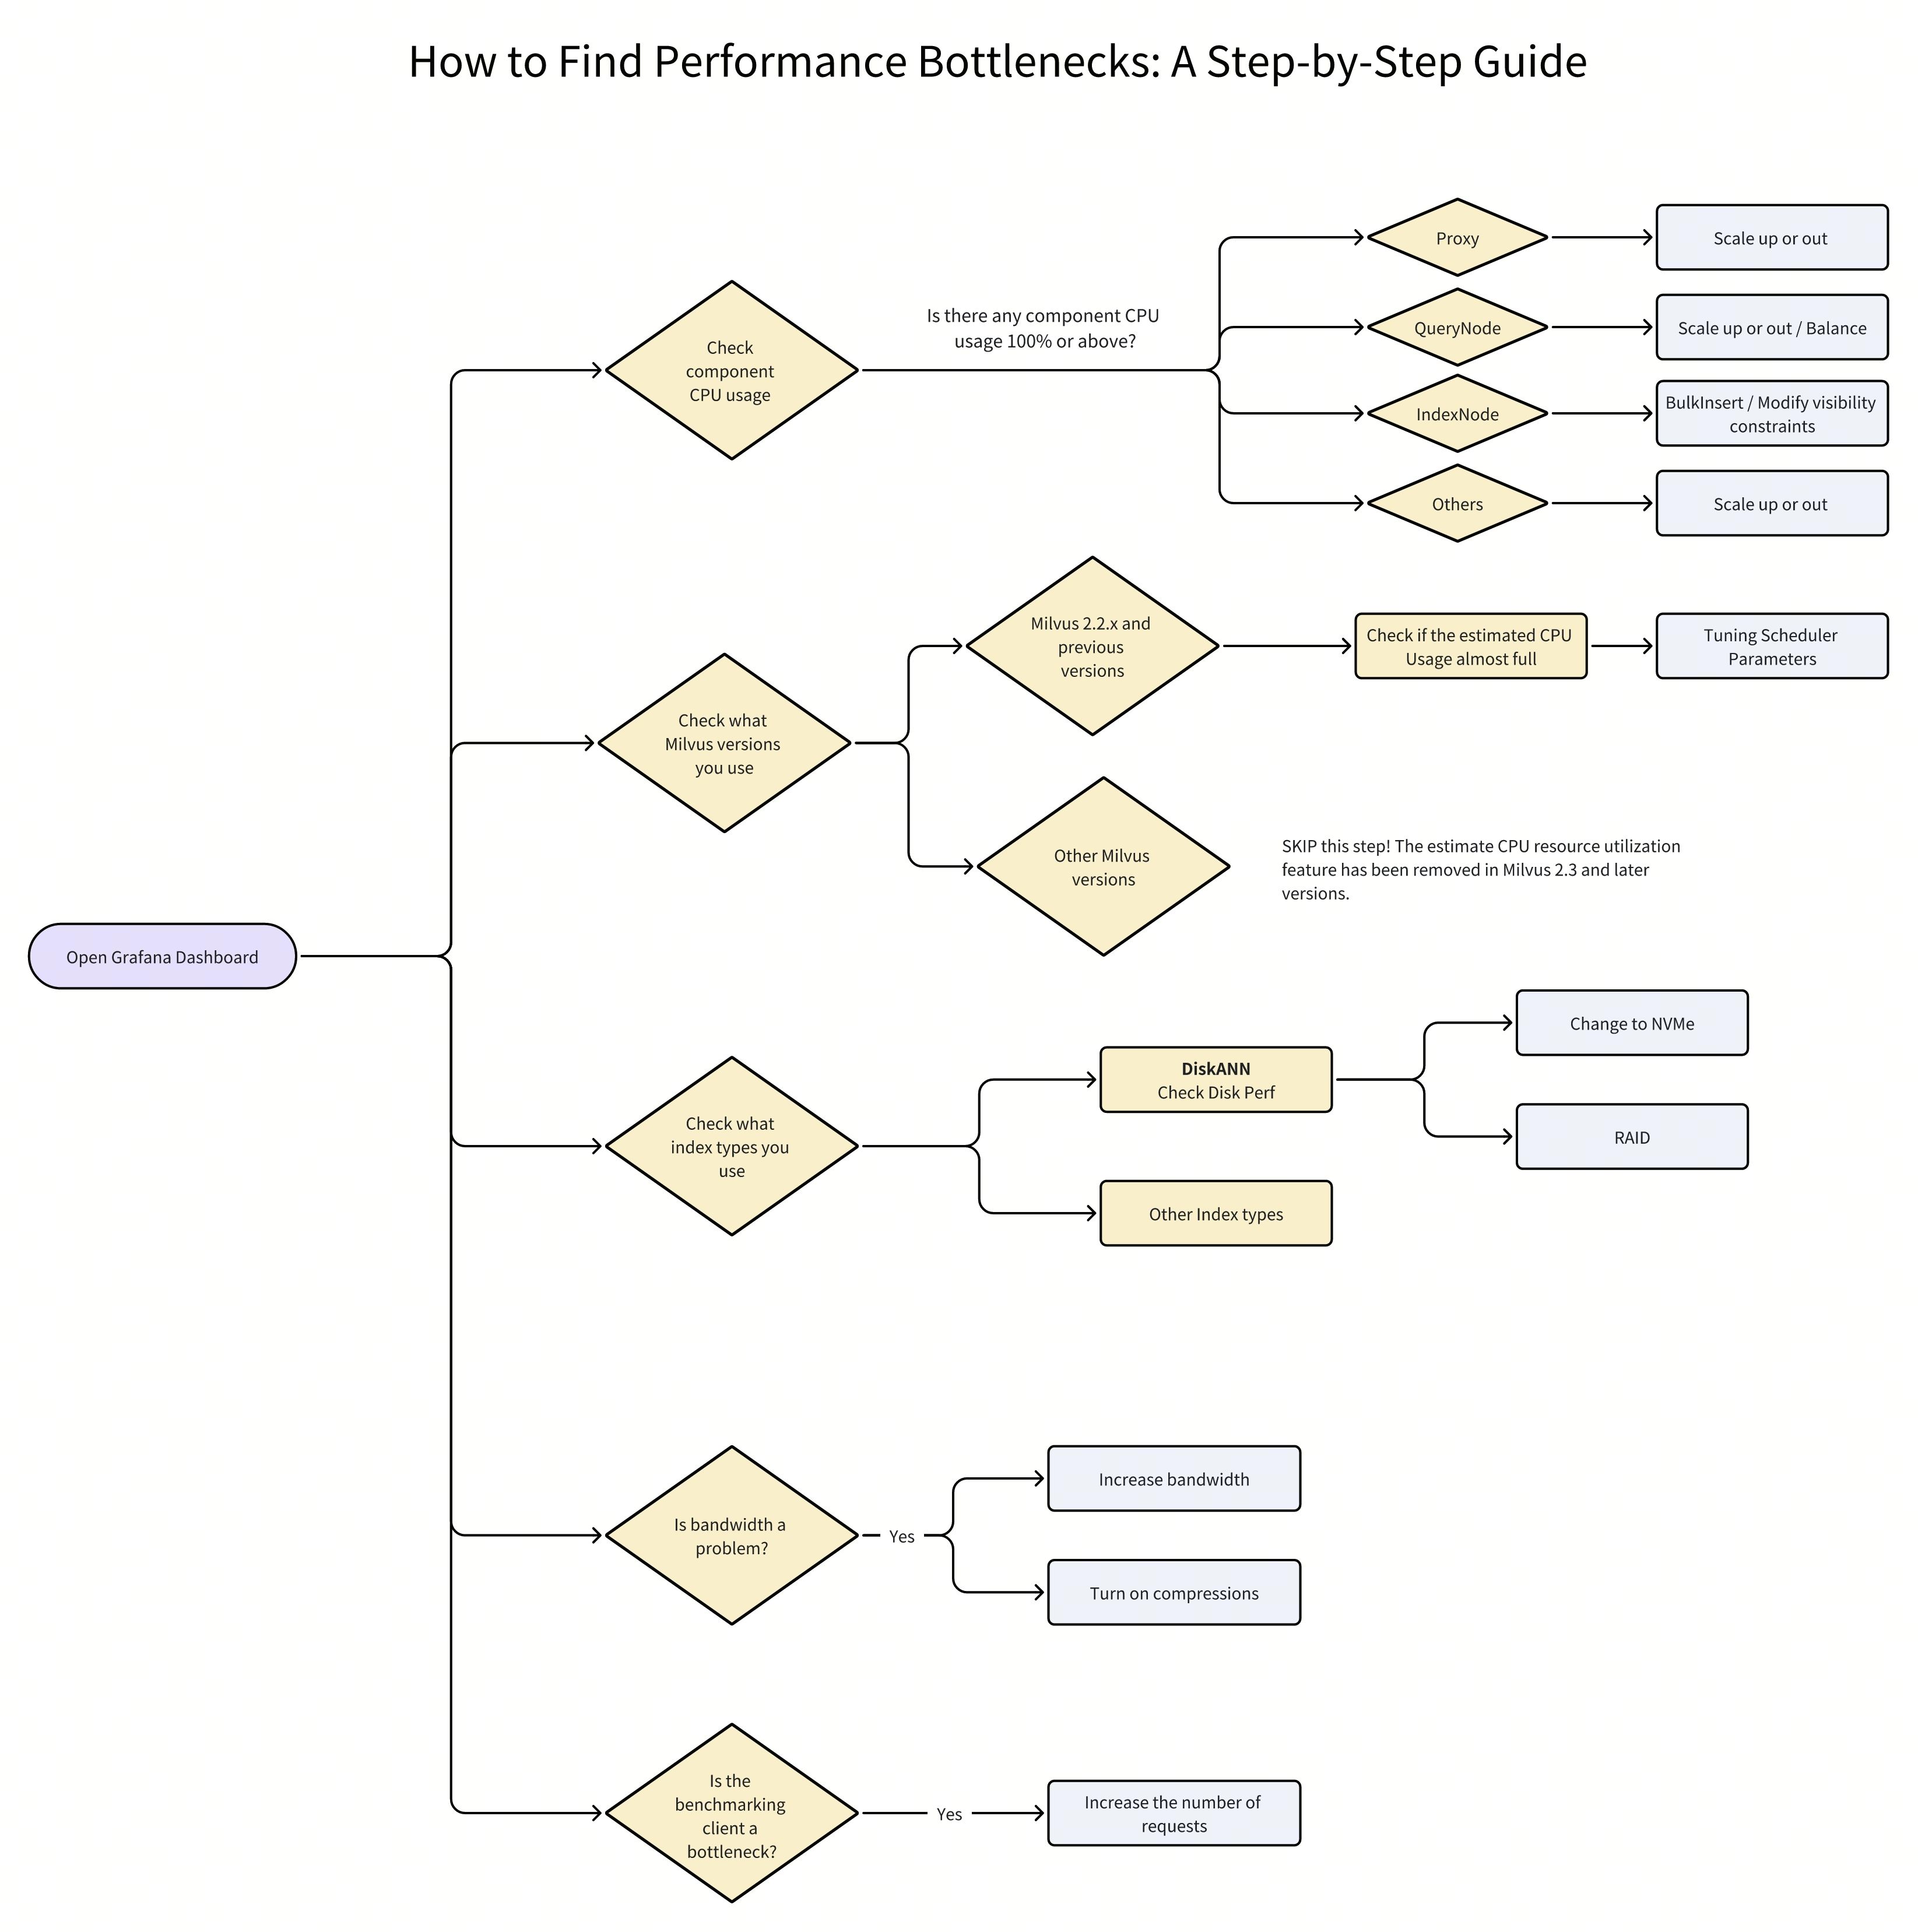 How to Find Performance Bottlenecks- A Step-by-Step Guide
Prerequisites
Before we start to monitor the performance of a vector database like Milvus, you need to deploy monitoring services on Kubernetes and visualize the collected metrics in the Grafana Dashboard.
Refer to our documentation pages for more information:
Important Note: Grafana's Minimum Intervals Can Impact Performance Monitoring Results
Before we start to monitor Milvus using Grafana, it's important to note that the minimum interval for display in Grafana may not always align with the specified interval. Consequently, some spikes in the associated figures may appear smoother or even disappear after averaging.
To solve this issue:
- Click on the metric name and select Edit or press e.
 Edit metric name
- Click on Query Options
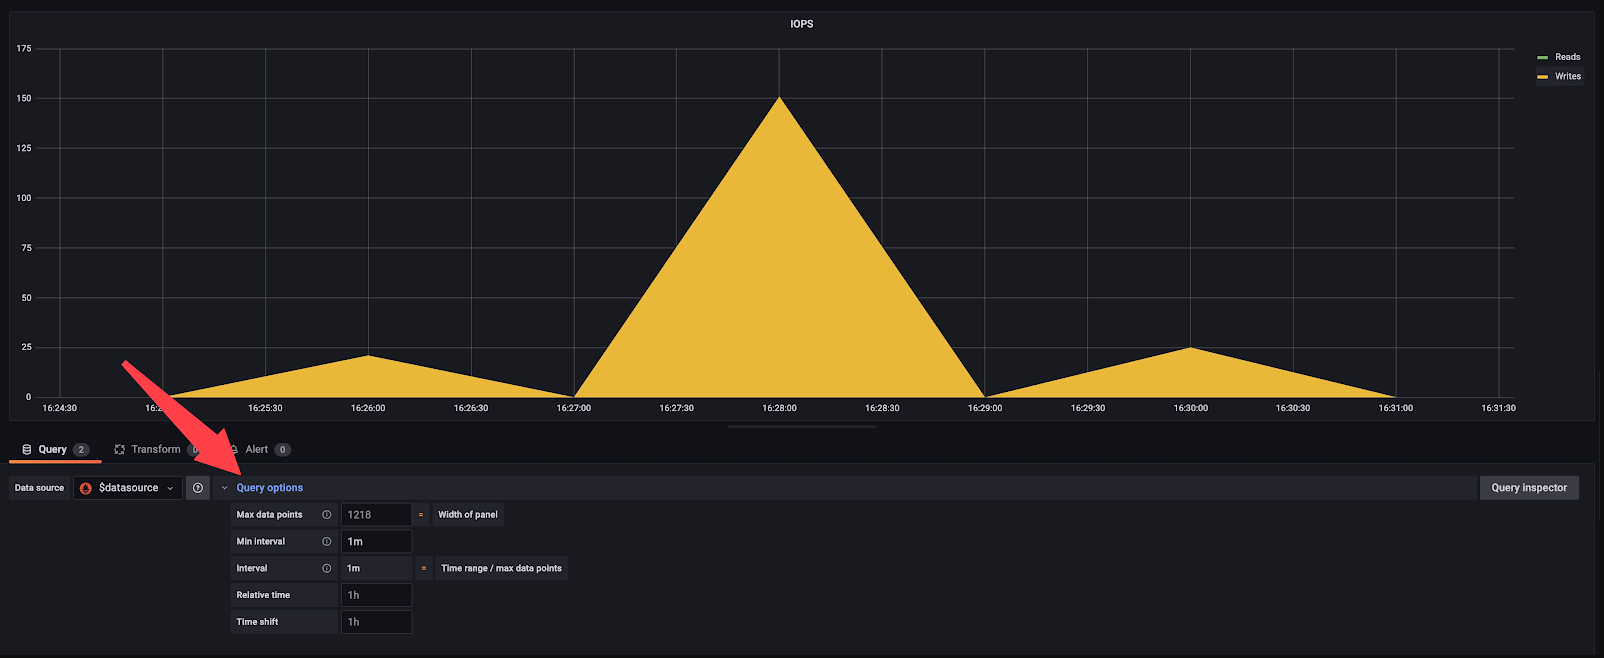 Query options
- Change Min interval to 15s
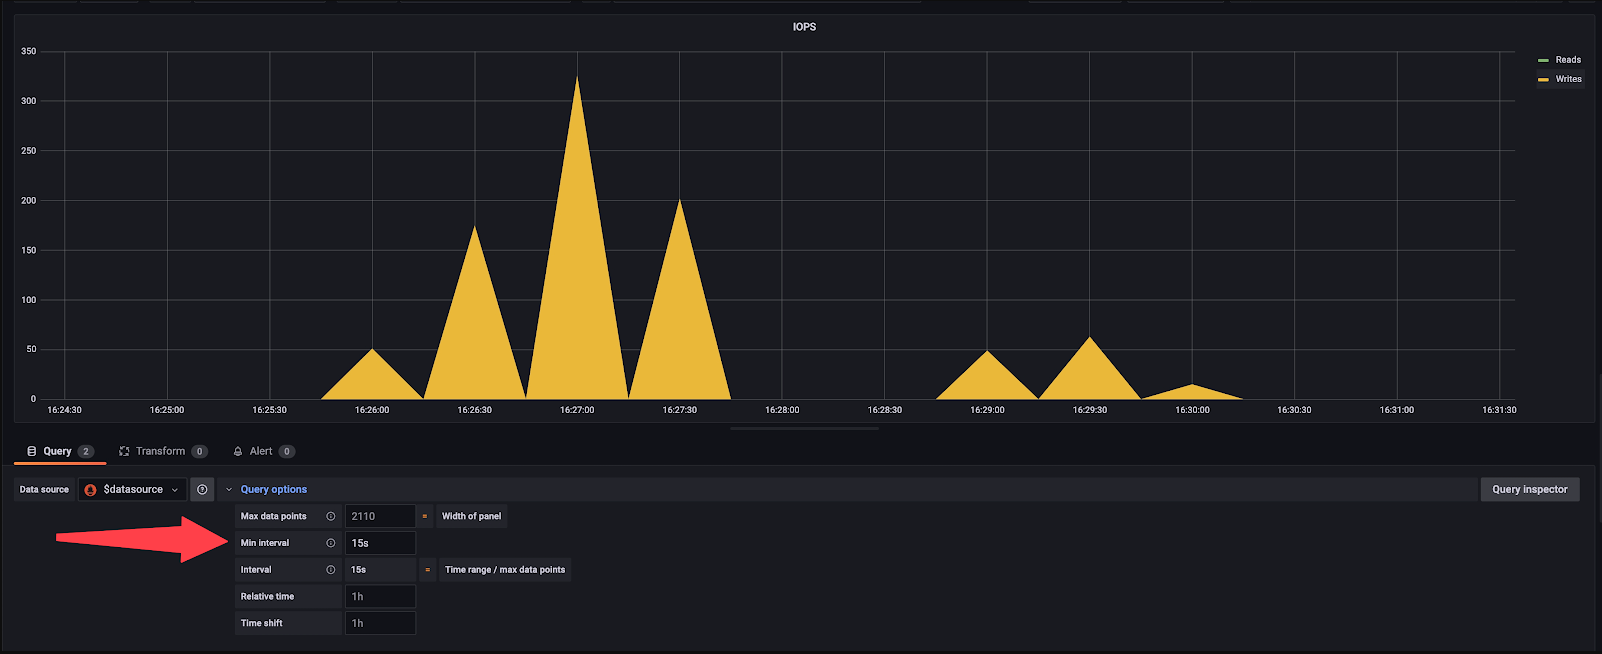 Minimum interval options
Important Note: A NUMA-Design Machine Can Affect Milvus’s Performance
Non-Uniform Memory Access (NUMA) is a memory design utilized in multi-processor systems. In a NUMA architecture, each CPU core is directly linked to a specific memory segment. Accessing local memory (memory attached to the processor executing the current task) is faster than accessing remote memory (attached to another processor). When a processor needs data from a memory segment that is not directly connected, it incurs additional latency due to the longer path required.
When deploying Milvus on a NUMA-enabled machine, it's advisable to allocate Milvus components using tools like numactl, cpuset, or similar utilities to ensure processor affinity. Modern processors, such as Sapphire Rapids, typically have 32 cores per NUMA node, whereas older processors usually feature 16 cores per node. To confirm, you can execute lscpu on your instance.
Now, let’s get started to monitor Milvus performance and spot possible bottlenecks.
1. Open Grafana Dashboard
After successfully deploying the monitor services on Kubernetes and visualizing metrics in Grafana, open the Grafana Dashboard. You should then be able to see the following dashboard.
 Grafana dashboard
Note: In this post, we use Grafana V2 for performance monitoring and bottleneck analysis. If you are using Grafana V1, please be aware that the monitoring procedures may differ slightly.
2. Check the CPU usage for each component.
We need to check the CPU usage for key components: Proxy, QueryNote, IndexNote, and Others. To check the CPU usage of each component, unfold Overview and then choose CPU usage.
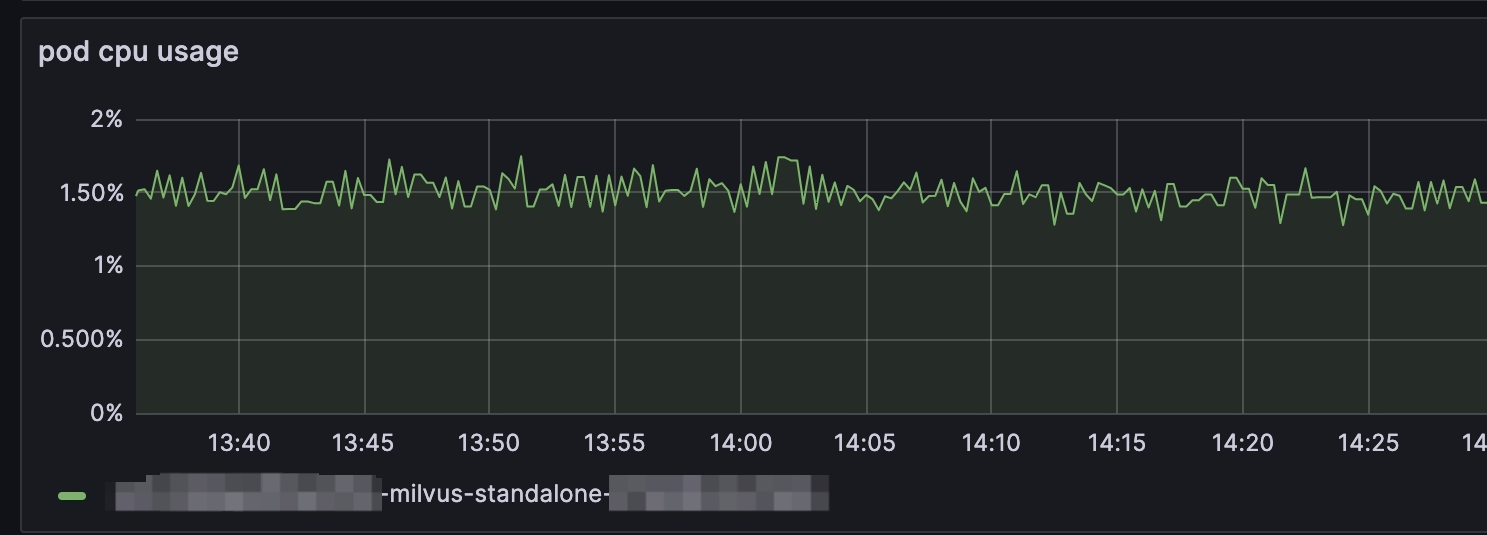 Pod CPU usage
 Pod CPU usage
Notes:
When monitoring CPU usage with Milvus, metrics are captured at the pod level. Operating Milvus in Standalone mode will display a singular chart line, reflecting the CPU usage for the sole pod. In contrast, running Milvus in Cluster mode enables the inspection of CPU usage across multiple pods. Within the chart above, you can identify the CPU utilization for the Proxy by a distinct light blue line, which, when it hits the upper threshold, indicates that the CPU limit has been reached.
If the panel is missing and you can not find any charts under Service Quality, you can either:
- Look into CPU Usage __under Runtime. It shows usage in Kubernetes units rather than percentages.
 CPU Usage
Or add a pod usage panel.
- Click the Add button and choose Visualization.
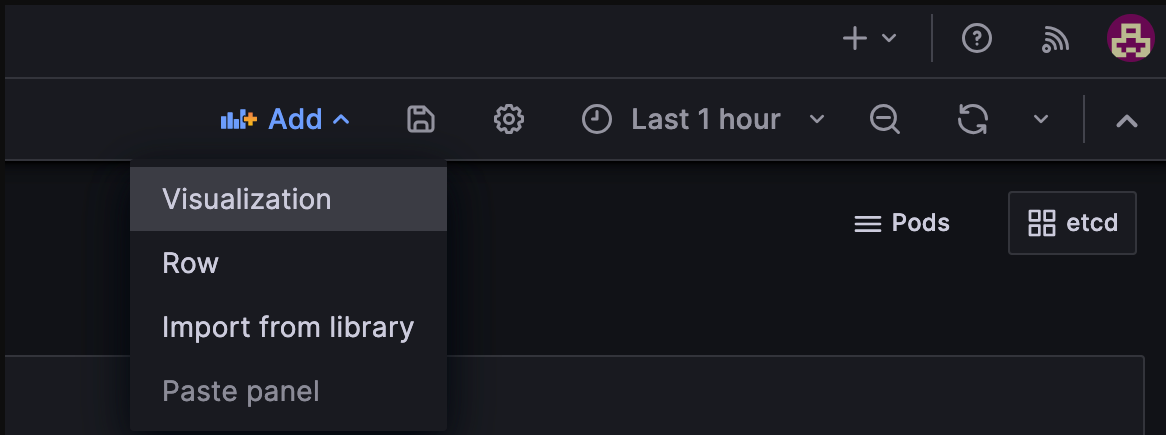 Add visualization
- Enter PromQL Query.
sum(rate(container_cpu_usage_seconds_total{namespace="$namespace",pod=~"$instance-milvus.*",image!="",container!=""}[2m])) by (pod, namespace) / (sum(container_spec_cpu_quota{namespace="$namespace",pod=~"$instance-milvus.*",image!="",container!=""}/100000) by (pod, namespace))
 Query inspector
- Choose your unit.
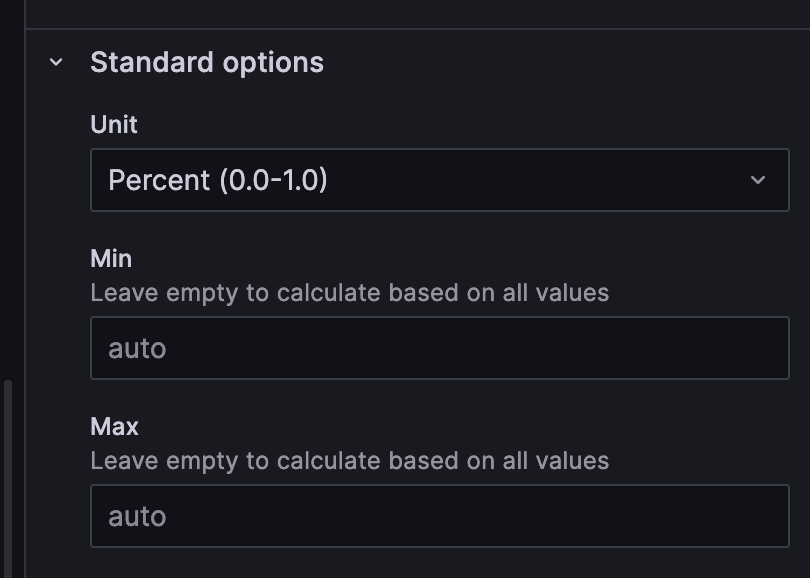 Standard options
- Save the settings.
Proxy
The proxy can become the bottleneck if QPS is high and performs network-intensive tasks, including searching vectors with large Top-Ks, enabled partition keys, and returning vectors themselves in the output fields.
How to fix this issue?
To address this issue, you can simply scale the Proxy vertically (use more CPU/Memory on the host) or horizontally (add more Proxy pods with a Load Balancer at the front).
QueryNode
If the performance is bounded by the CPU usage of QueryNode, then there might be several reasons, and you can follow the instructions as shown in the flowchart below.
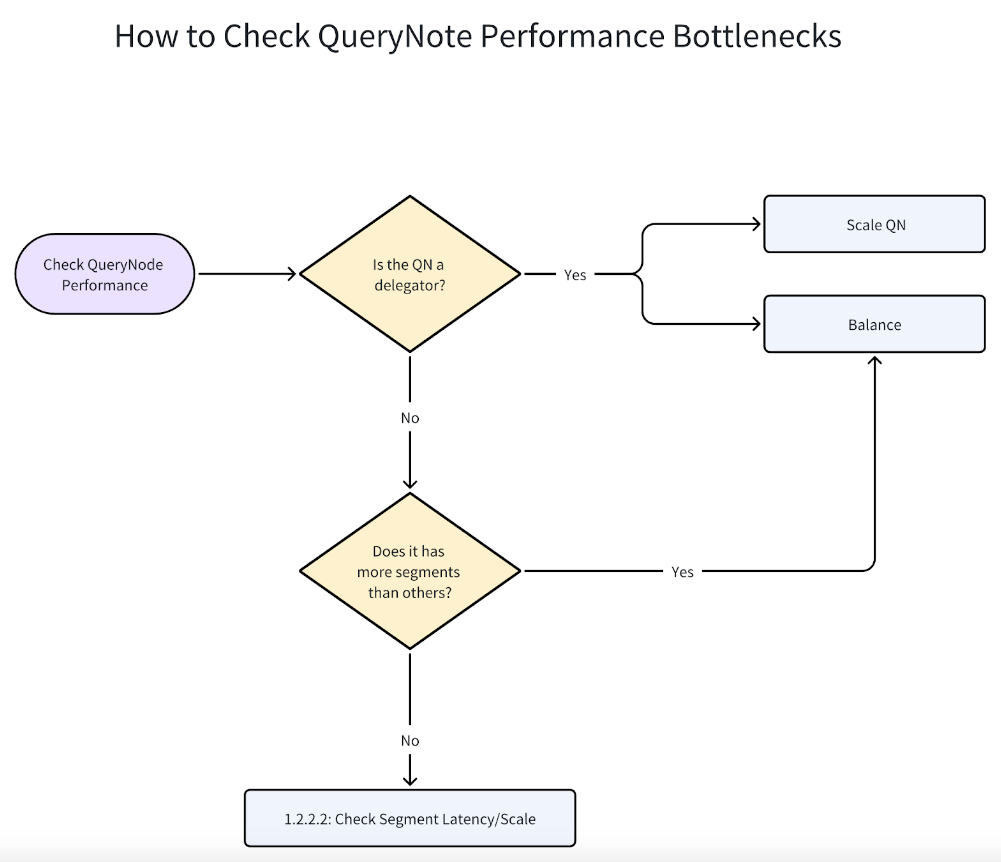 How to check QueryNote performance bottlenecks
If one of the QueryNodes reach 100% CPU usage, as shown below, it might be a delegator.
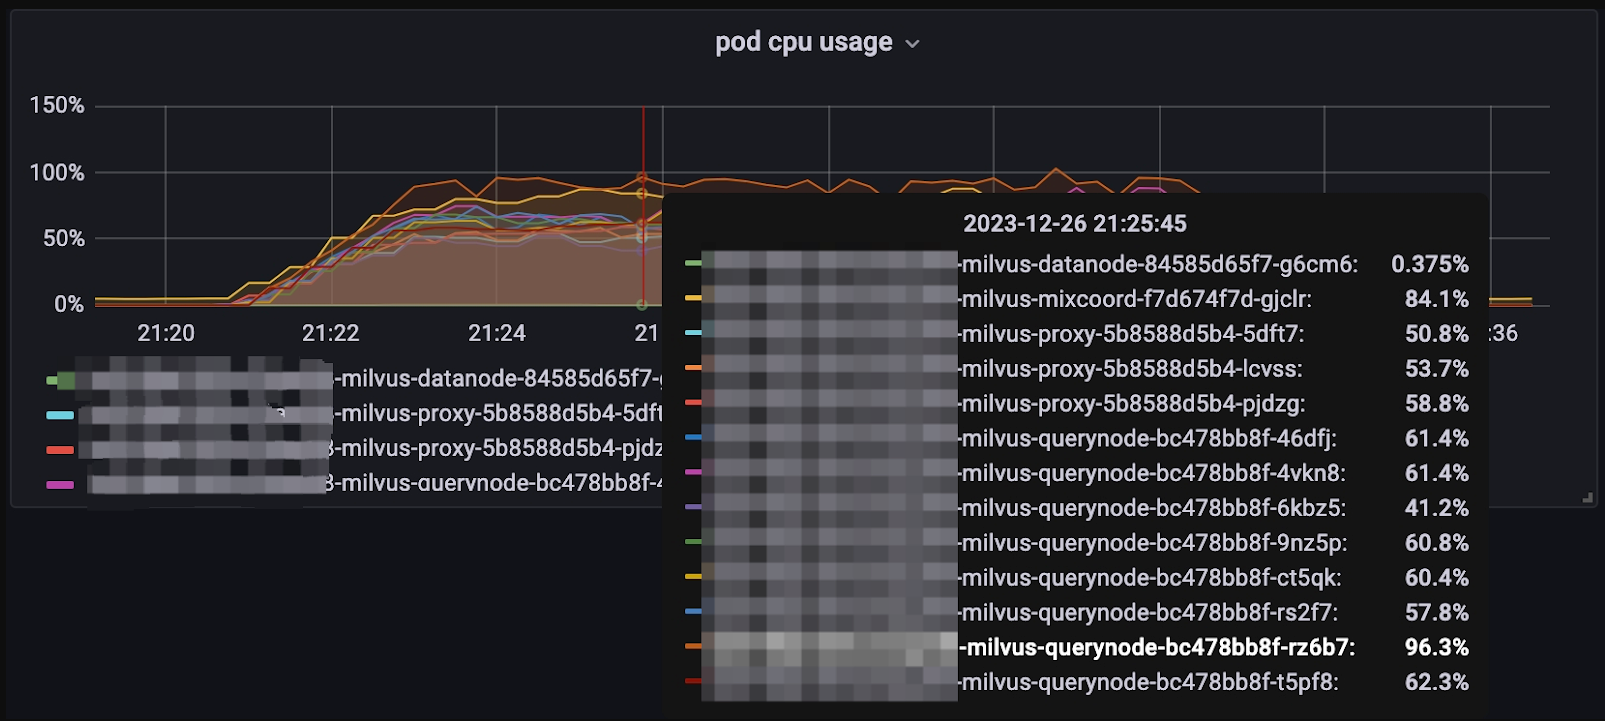 Pod CPU usage
The role of the delegator in Milvus is like a troop commander. When a search request hits Proxy, Proxy will redirect the request to the delegator first, then redirect to other QueryNodes and start to search in each segment. The search results are returned in the reversed order. You can check whether the QueryNode is a delegator by choosing: Query Node > DML Virtual Channel
 DML virtual channel
To observe the overall distribution of the segments, choose Query > Segment Loaded Num on the Dashboard.
 Segment loaded num
How to fix this issue?
Is it necessary to have such a high number of QueryNodes for the volume of data you have inserted? An excessive number of QueryNodes can detract from performance due to the increased number of messages the delegator must handle. Consequently, scaling down the number of QueryNodes could alleviate the strain on the delegator.
Additionally, think about vertically scaling your QueryNode—this involves enhancing the computational resources of a single pod or instance that houses a QueryNode, like CPU and memory. This adjustment can significantly improve processing capabilities without adding to the message load managed by the delegator.
If you hold a static database, you could mitigate this problem by manually balancing the segments to other QueryNode so that the delegator does not search segments but focuses on distributing requests and reducing results. To achieve this,
Turn off the
autoBalancein the Milvus YAML fileCall
LoadBalanceAPI from SDK. Reference: Balance Query Load
If autoBalance is off and new vectors are inserted into the database, you might need to trigger LoadBalance again.
Note: If you’ve done everything specified above, and the delegator is still a bottleneck, please file an issue or contact us directly.
IndexNode
When IndexNote reaches 100% CPU usage, it is mainly because IndexNodes are building indices. When there are no immediate time constraints on search requests and the influx of new data has temporarily ceased, it is advisable to allow the IndexNode to complete the index-building process. This approach ensures that all indices are constructed successfully before any search operation is initiated. Engaging in search queries while concurrently inserting data into the system can lead to a noticeable degradation in search performance. The amount of degradation depends on several factors, including how you insert these vectors and whether you want to see these newly inserted vectors returned immediately after insertion.
How to fix this issue?
Here are some tips to minimize the impacts:
If possible, use bulk insert rather than insert vectors one by one. This reduces network transmissions and skips the process of "growing" the segments. Hence, it speeds up the insertion process and searches. For more information, refer to bulk insert documentation.
If visibility is not crucial, it is advisable to:
Ignore growing segments; pass
ignore_growingin the search parameters like in https://milvus.io/docs/search.md.Change consistency levels to
Eventuallyin the search API call. For the consistency level, visit https://milvus.io/docs/consistency.md.
Other components
Within the architecture of Milvus, components like MixCoord, DataNode, and others are designed to efficiently handle their respective tasks, ensuring that they seldom become the limiting factor in search operations under default conditions. However, when monitoring reveals their CPU utilization approaching full capacity, indicating a potential bottleneck, immediate measures to scale these components become necessary.
3 Check what Milvus versions you use
If you use Milvus 2.3.x and later versions, please SKIP THIS STEP.
Milvus 2.2.x and previous versions allow you to estimate their CPU resource consumption. However, this feature has been removed in Milvus 2.3.x and later versions because it might cause performance issues.
The y-axis in the below diagram represents the product of the number of CPUs and percentages, where, for instance, the full utilization of 12 CPUs displays as 1200 on the y-axis.
 Estimate CPU usage
Important to Note: This estimation may sometimes inaccurately perceive CPU busyness, leading to task queuing despite low actual CPU usage.
How to fix this issue?
Tuning queryNode.scheduler.cpuRatio to lower values, default 10.0.
4 Check Disk Performance
If you choose DiskANN when you create indices, check your disk performance.
NVMe SSDs are recommended if DiskANN is the index type. Building and searching disk indices on SATA SSD or HDD can be heavily bounded by I/O operations, which result in large latency and low QPS.
To check disk performance, you could run fio or similar I/O benchmark tools to test the IOPS. An NVMe SSD should have around 500k IOPS.
# Write Test

fio -direct=1-iodepth=128 -rw=randwrite -ioengine=libaio -bs=4K -size=10G -numjobs=10 -runtime=600 -group_reporting -filename=/fiotest/test -name=Rand_Write_IOPS_Test

# Read Test

fio --filename=/fiotest/test --direct=1 --rw=randread --bs=4k --ioengine=libaio --iodepth=64 --runtime=120 --numjobs=128 --time_based --group_reporting --name=iops-test-job --eta-newline=1  --readonly
To read pod-level IOPS in Grafana:
- In the top-right corner, click Pod and click Kubernetes / Compute Resources / Pod; If you are on the V2 Dashboard, click Milvus2.0.
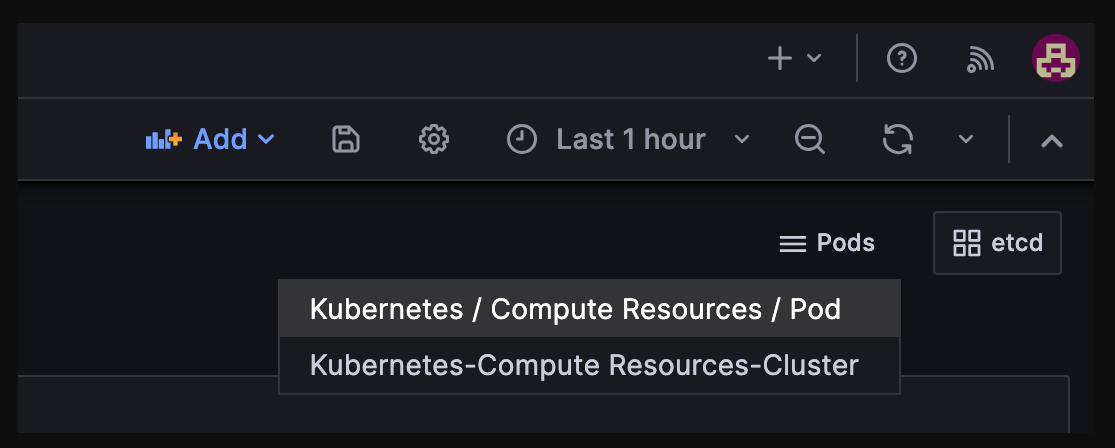 Kubernetes compute resources
- Choose the pod you want to inspect:
 CPU usage
- Scroll down and look for Storage IO.
 Storage IO
How to fix this issue?
Consider upgrading from SATA SSDs or HDDs to NVMe SSDs to reduce latency in your current setup. Many cloud providers, such as AWS, offer NVMe SSD storage options. For instance, AWS m6id instances within the m6 series are equipped with local NVMe-based SSDs. However, it's crucial to note that although EBS employs NVMe drivers, they do not provide the same low latency benefits as local NVMe SSDs.
When it comes to disk indices, we strongly recommend opting for NVMe SSDs. However, if you already have SATA SSDs or HDDs, configuring them in a RAID (Redundant Array of Independent Disks) setup can help decrease latency.
5 Check your Bandwidth
Bandwidth limitations can often emerge as a critical bottleneck within a system, posing challenges that may not be immediately apparent without deliberate consideration. Indirect effects may manifest, such as stagnant Queries Per Second (QPS) despite efforts to enhance system performance or unexpectedly prolonged execution times for operations like gRPC.
Understanding the role of bandwidth in these scenarios is crucial for diagnosing and addressing performance limitations. For example, in a KNN search request with a query dimension of 1024 and TopK set to 100, each request might consume approximately 4.8 KB for two-way communication between client and proxy. A QPS of 1000 translates to around 4.7 MB of data flowing through the channel. Therefore, the bandwidth should be capable of sustaining at least 37 Mbps to avoid capping QPS.
 Workflow
While this may not seem significant initially, aiming for higher QPS or including vectors in the output fields can dramatically increase the required bandwidth. For instance, if vectors need to be included, the bandwidth requirement jumps to at least 3 Gbps in the aforementioned example.
Calculations can be tedious, but monitoring tools like Grafana can help check inbound and outbound bandwidth to assess system performance effectively.
 Received byte rate
 Send byte rate
Note: Don't forget to check the bandwidth among pods within Milvus Pods if you deploy Milvus in a Cluster-Mode.
The graph below only shows the proxy's network usage when checking other pods. Navigate to pod usage, and you will see:
 Bandwidth
How to fix the issue?
- Increase Bandwidth
To address bandwidth limitations, consider increasing bandwidth through cloud consoles or contacting cloud providers or DevOps teams for assistance.
- Turn on compression
We are building a new feature in Milvus that allows you to implement gRPC compression between components in Milvus and between Milvus and the SDK client. This practice can significantly reduce data volume by compressing it, although it may lead to higher CPU usage due to encoding and decoding processes. This feature is expected to be available in Milvus 2.4.x. Stay tuned.
6 Check the benchmarking client
Consider a scenario where a tap slowly drips water into a large pipe. If the flow from the tap is minimal, it will never fill the pipe to its capacity. Similarly, when a client sends only a few requests per second, it falls short of leveraging the full capabilities of Milvus, which are designed to handle much larger volumes of data efficiently. To test whether the client is the bottleneck, you may try to:
Increase the concurrency to see if there is any difference.
Fire multiple clients on different machines/hosts.
How to fix the issue?
If the client is the performance bottleneck, try to increase the number of your requests.
Review and adjust any network limiters that might be capping the data flow.
If you use PyMilvus
Use
spawninstead offorkin multi-processing.In each process, import
from pymilvus import connectionsand runconnections.connect(args).
Scale horizontally - run more clients until QPS does not vary.
Contact Us
We trust this guide has turbocharged your Milvus performance to align perfectly with your needs! However, if you haven't identified the performance bottleneck or need assistance in addressing such issues, don't hesitate to reach out to us. We're here to propel you past those challenges!
You can reach us by:
- Performance Evaluation and Monitoring Metrics
- Performance Monitoring Tools
- How to Find Performance Bottlenecks: A Step-by-Step Guide
- Contact Us
Content
Start Free, Scale Easily
Try the fully-managed vector database built for your GenAI applications.
Try Zilliz Cloud for FreeKeep Reading

Understanding Vector Databases: Compare Vector Databases, Vector Search Libraries, and Vector Search Plugins
Deep diving into better understanding vector databases and comparing them to vector search libraries and vector search plugins.
Safeguard Data Integrity: Backup and Recovery in Vector Databases
This blog explores data backup and recovery in vectorDBs, their challenges, various methods, and specialized tools to fortify the security of your data assets.

Maintaining Data Integrity in Vector Databases
Guaranteeing that data is correct, consistent, and dependable throughout its lifecycle is important in data management, and especially in vector databases
