Understanding Application Performance Monitoring (APM)

Understanding Application Performance Monitoring (APM)
Have you ever experienced slow load time or errors when using an app or website? You might want to know why these issues occur and how to handle them. That's where Application Performance Monitoring (APM) comes in. It’s a collection of tools that monitors everything from website load times to app performance and helps to ensure that apps run smoothly and load quickly.
Now, let's see in detail what APM is, how it works, and its importance, benefits, and challenges.
What is APM (Application Performance Monitoring)?
Application performance monitoring (APM) is the practice of using tools designed to help IT professionals monitor the performance and availability of software applications. It is like a regular app check-up to ensure they’re healthy and running as expected.
With APM, IT teams can:
Keep their apps running smoothly
Find and fix problems before users notice them
Understand user interactions and behavior
Optimize app performance
Application performance monitoring is a subset of application performance management, and these terms are often used interchangeably. However, APM only focuses on tracking an application's performance, while APMg focuses on controlling and managing application performance throughout the entire lifecycle. In other words, monitoring is a part of management.
How Application Performance Monitoring Works
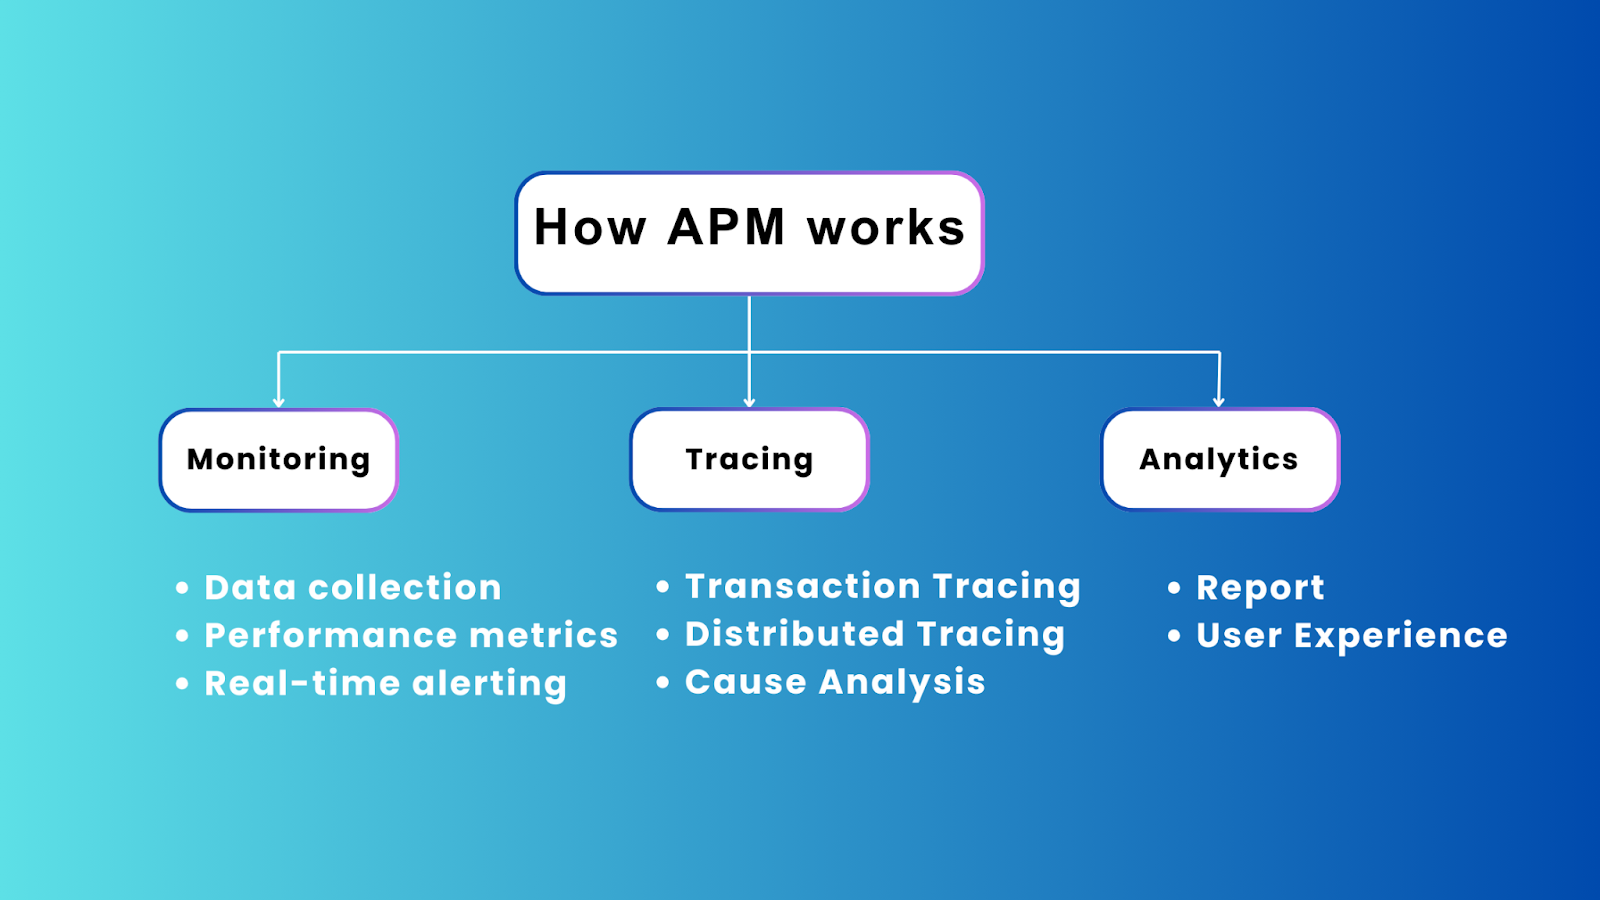
Now that we've established what APM is, let's break down how it works. APM collects different types of information to understand app performance. It consists of three primary components:
Monitoring
Tracing
Analytics
 How APM works.png
How APM works
Monitoring
Monitoring is the foundation of APM, where data is collected and analyzed from different sources to understand application performance. There are some critical components of monitoring:
Data Collection
Metrics
Real-Time Alerting
Data collection
Data collection is the starting point of the monitoring process. APM tools use scripts embedded within an application’s code to constantly gather real-time data from different sources, including servers, databases, APIs, and user interfaces (UIs). The data could include system metrics and application logs like CPU usage and memory consumption, response times and error rates, and more.
Metrics
Once data is collected, the next step is to focus on the most relevant metrics; APM tools monitor a range of metrics that clearly show the application’s performance. These metrics include:
Performance Metrics:
Response Time: The time it takes for an application to respond to user requests.
Error Rate: Tracks the percentage of requests that fail due to errors and helps identify stability issues.
Throughput: Refers to the number of requests the application processes over a specific period (e.g., per second). This metric helps assess the application’s capacity.
Resource Usage Metrics:
CPU Usage: Monitoring CPU usage is essential, as high usage can lead to performance issues.
Memory Usage: Observing memory usage helps identify memory leaks in memory allocation.
Business Metrics:
Transaction Success Rate: This measures the percentage of successful transactions, such as purchases or form submissions. A drop in this metric could indicate issues that directly affect the business.
Conversion Rate: Monitors how well the application meets its objectives, directly related to overall performance and user experience (UX), such as turning visitors into customers.
Apdex Score: It measures user satisfaction and tolerance based on response times.
Real-Time alerting
Real-time alerting is an essential feature of APM. It alerts when the application goes wrong or performance drops. Administrators can set custom alerts based on metrics. For instance, if the response time exceeds 2 seconds, an alert can notify the operational team. Alerts are sent via email, SMS, or integrated notification systems. This helps operations teams fix problems, minimize user impact, and maintain application stability.
Tracing
Tracing helps to understand how requests move through an application. Networked architectures and microservices make tracing important for identifying slowdowns and maintaining system stability as applications get more complex. It includes:
Transaction Tracing
Distributed Tracing
Cause Analysis
Transaction Tracing
Transaction tracing tracks user transactions or requests as they move through the application.
It records each step, from when a user does something to when they see the result.
It measures how long each step takes.
This helps find which parts of the app might be slowing things down and where errors occur during a transaction.
Distributed Tracing
In a distributed or microservices architecture, requests often traverse multiple services before completion. Distributed tracing:
Follows requests as they move between these various services.
Shows how the services work together.
It helps find problems that happen between different parts of the app.
Cause Analysis
Tracing helps find the root cause of problems by linking performance data with error logs. Logs are text-based records of events and errors that occur within an application. For example, tracing might show that the database is overwhelmed with slower query responses if response times increase during peak traffic. It includes:
Code-level issues: Analyzing slow database queries, inefficient code, and other code-related problems.
Infrastructure problems: Identifying network outages, server overload, and other infrastructure problems.
Configuration errors: Figuring out misconfigured services, improper cache settings, and other configuration issues.
After an issue is resolved, tracing data is used to investigate what went wrong and how to prevent it from happening again.
Analytics
Analytics is the final component of APM, where systems translate the data gathered from the above process into useful information. Analytics provides a more complete understanding of trends, user experience, and optimization opportunities than just real-time tracking and monitoring.
Report and Visualization
APM tools provide reporting and visualization, which help teams understand how their applications are doing by showing performance data. They create charts and graphs to show the application's performance changes over time and summarize key information for a quick overview. They also use performance data to provide reports on a daily, weekly, or monthly basis.
User Experience (UX)
One of the most important factors in application performance is the UX. APM tools can track user experience metrics such as page load, response times, and how users navigate through the application. Real user monitoring techniques collect data from actual user interactions, and this data helps identify which parts of the application need improvement.
Comparison
The term Application Performance Management (APM) is sometimes used interchangeably with other concepts, and It’s important to differentiate its unique focus when comparing it with Observability and Infrastructure Monitoring. Now, let's see the difference between each term.
Application Performance Management (APM) vs. Observability
Application Performance Monitoring (APM) and observability are related concepts, but they serve different purposes in managing and understanding the performance of applications.
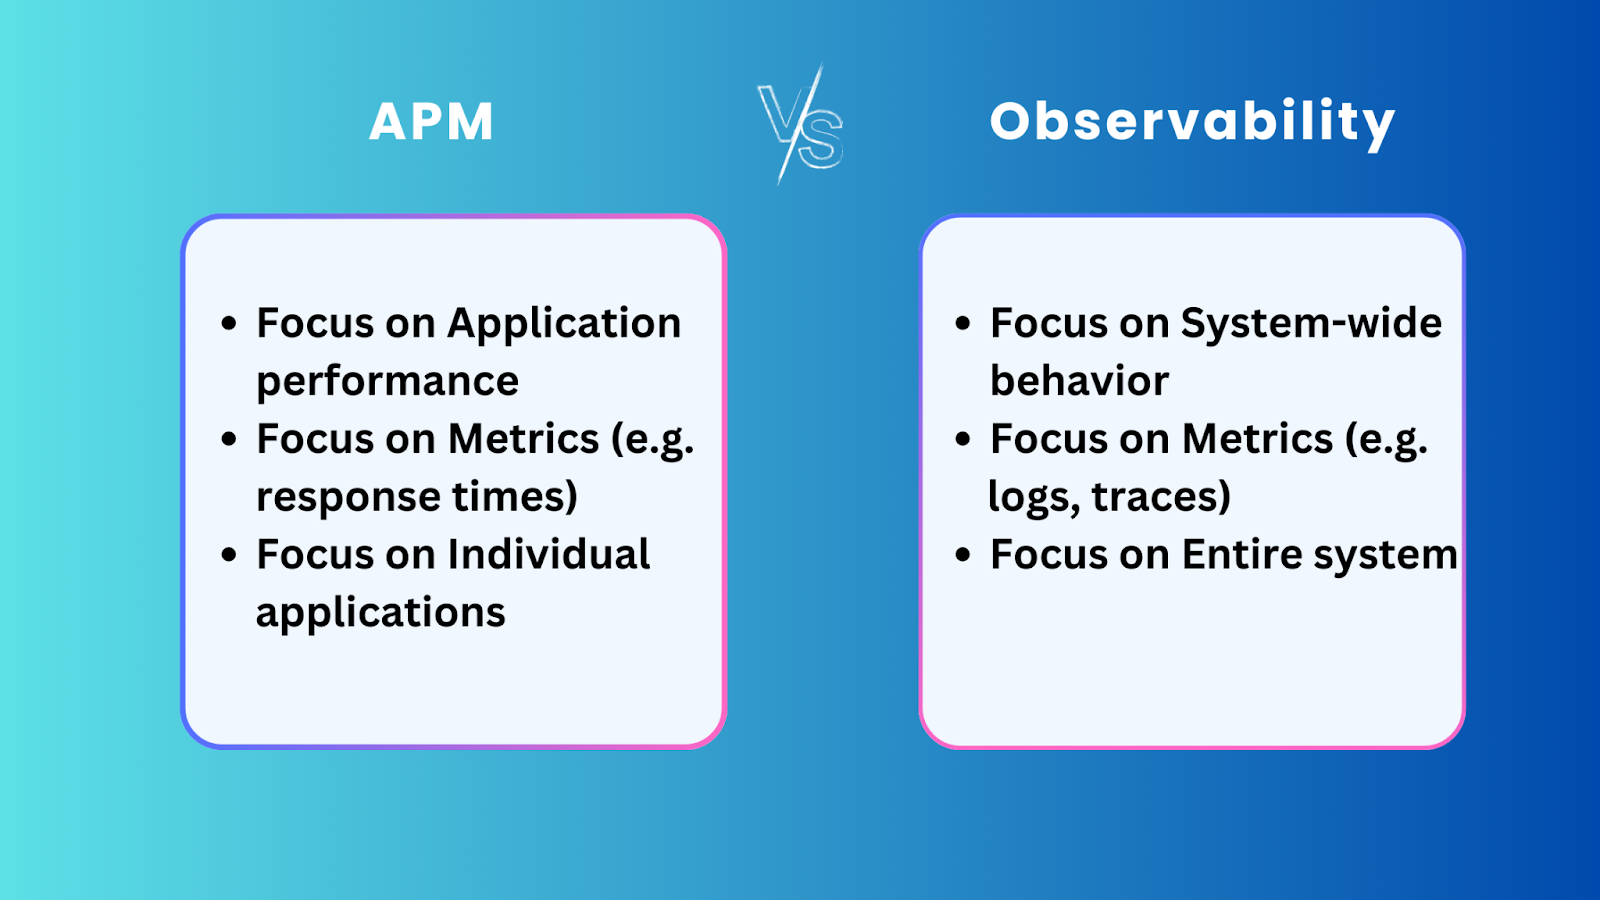
 APM vs Observability.png
APM vs Observability
APM's primary goal is monitoring application availability and performance. It tracks specific metrics like response times, error rates, and resource usage to maintain and optimize individual application performance.
Observability is about understanding the whole system, including things APM might not cover. It collects and analyzes data, including metrics, logs, traces, and events, to understand a system's behavior. This works particularly well in large-scale applications like LLM applications, where the system is complex and distributed and requires deeper inspection.
Platforms like Langfuse and Ragas provide comprehensive observability and product analytics for applications built on large language models (LLMs) suited to their particular requirements.
Langfuse is an open-source platform. Its observability capabilities can seamlessly integrate with vector databases such as Milvus and Zilliz Cloud (managed Milvus) solutions to enhance retrieval-augmented generation (RAG) workflows by monitoring vector embedding quality and relevance.
To learn how to integrate Langfuse's observability capabilities with Zilliz Cloud's vector database and Milvus into your applications, please refer to the following resources:
Application Performance Management (APM) vs. Infrastructure Monitoring
APM and Infrastructure Monitoring are both important for maintaining the health and performance of an organization’s IT environment, but they target different layers of the IT stack.
We have seen in detail that APM is application-centric, focusing on performance and availability. It monitors crucial metrics, including response times, error rates, and transaction flows, to improve the application and ensure a better user experience.
Infrastructure monitoring, in contrast, is system-centric, focusing on the hardware and software components that support applications. It maintains the health of servers, networks, and other infrastructure components. Infrastructure Monitoring tools help teams detect and address the issues at the system level before they affect application performance. Different tools are used for Infrastructure Monitoring tools, including Prometheus and Datadog.
Benefits and Challenges of APM
Now that we have covered the important aspects of APM, it is necessary to understand there are opportunities and challenges associated with APM, just like any technology solution. APM tools help improve application performance and user experience but come with complexity and data management challenges. There are four major benefits to APM:
Better User Experience: By monitoring performance metrics, teams detect and resolve performance issues before they impact end users, it helps maintain a high level of service quality.
Reduced Downtime: With APM, problems can be found and fixed before they cause large outages. Real-time monitoring and alerting inform teams about problems as soon as they occur, minimizing the impact on the application’s availability.
Better Decision-Making: APM provides information that helps businesses improve their products over time and make informed decisions about system architecture and resource allocation.
Cost Savings: APM can help businesses reduce the costs of running their apps by finding inefficiencies.
Now let's take a look at the challenges of APM:
Complexity in Implementation: Implementing APM can be complex, especially in distributed systems or microservices environments. Configuring APM tools to monitor all relevant components can take a lot of time and experience.
Data Overload: APM can generate so much information that it can be overwhelming to manage and analyze. It's sometimes hard to know what's important without proper filtering and prioritization.
Cost of APM Tools: High-quality APM tools can be expensive, especially for small businesses or startups. The cost includes the tool itself and the resources needed for implementation and staff training.
Maintaining Relevance of Metrics: Some Metrics may become less relevant as applications change. To keep APM effective, teams must constantly update and improve what they monitor, which can be time-consuming.
Skill Requirements: Specialized knowledge and skills are necessary for the effective use of APM tools. Teams must understand how to configure, interpret, and act on the data provided by APM tools, which may require additional training.
Use Cases of APM
Application Performance Monitoring (APM) is a valuable tool across many different industries, helping businesses improve their digital services for customers and industries, including:
E-commerce: Speed and reliability are important during online shopping. Customers want websites to load quickly and transactions to be smooth. Even a small delay can lead to huge sales losses. For example, a store on Black Friday could experience a sudden rush of customers, which could slow down or even crash the website. APM tools can see this and prepare the website to handle the extra traffic so customers don’t have problems.
Finance/Banking: Users must trust that their transactions will be processed accurately and without delay. APM ensures that all transactions are processed securely, quickly, and error-free.
Gaming: Performance is everything in gaming. Players want games to function smoothly, with no delays. APM tools monitor the game’s performance in real time, tracking metrics like frame rate and server latency. This helps developers ensure that the game provides gamers with a consistent and entertaining experience.
Monitoring platforms like New Relic, Dynatrace, and Grafana are commonly used. New Relic provides real-time insights into application and infrastructure performance and offers different monitoring features, including APM, infrastructure monitoring, and log management.
The performance data collected by these platforms can be sent to Zilliz Cloud, which is designed to handle billion-scale complex data efficiently in the form of vector embeddings. Together, such combinations offer interactive visualizations that allow you to explore data easily, understand context, and resolve problems faster. Its alerts detect changes in key performance metrics and let you know when something needs your attention.
Grafana is an open-source visualizing stack that can connect with all data sources. By pulling up metrics, it helps users understand, analyze, and monitor massive amounts of data. Milvus uses Grafana’s customizable dashboards for metric visualization.
Frequently Asked Questions (FAQs)
- What is APM (Application performance monitoring)?
Application performance monitoring (APM) uses tools designed to help IT professionals monitor software applications' performance and availability.
- What is application performance monitoring used for?
Application performance monitoring identifies and resolves performance issues, improves user experience, minimizes downtime, and maximizes resource efficiency.
- What is the difference between observability and APM?
APM is a tool designed to maintain and optimize the performance of individual applications. On the other hand, Observability is about understanding the entire system, including aspects APM might not cover.
- What are APM metrics?
The application performance monitoring (APM) agent collects and combines critical metrics from your application and infrastructure, allowing your IT or DevOps team to identify and fix functionality issues before they negatively impact business outcomes.
- How does APM work?
Application performance monitoring (APM) works by monitoring application performance metrics, tracing transactions, and analyzing data to identify issues and trends.
Related Resources
- What is APM (Application Performance Monitoring)?
- How Application Performance Monitoring Works
- Comparison
- Benefits and Challenges of APM
- Use Cases of APM
- Frequently Asked Questions (FAQs)
- Related Resources
Content
Start Free, Scale Easily
Try the fully-managed vector database built for your GenAI applications.
Try Zilliz Cloud for Free


