Optimizing Embedding Model Selection with TDA Clustering: A Strategic Guide for Vector Databases
By interpreting insights from a recent webinar hosted by Zilliz, featuring speakers Gunnar Carlsson and Gabriel Alon – written by Wania Shafqat
Large Language Models (LLMs) have transformed data processing, yet their performance is closely tied to the quality of the embeddings that power them. In our recent webinar, Gunnar Carlsson, Co-Founder and CTO of Blue Light AI, Gabriel Alon, senior Data Scientist, and Stefan Webb, Developer Advocate at Zilliz, explored how Topological Data Analysis (TDA) clustering exposes hidden weaknesses in embedding models. This article breaks down key insights from the session and techniques to enhance performance, along with additional research and practical tips to help you confidently select and develop models that suit your unique needs.
The Challenge: Evaluating Embedding Models
Embedding models convert raw, unstructured data (text, images, videos) into high-dimensional vectors encapsulating semantic meaning. However, selecting the right embedding model is challenging in any vector database deployment.
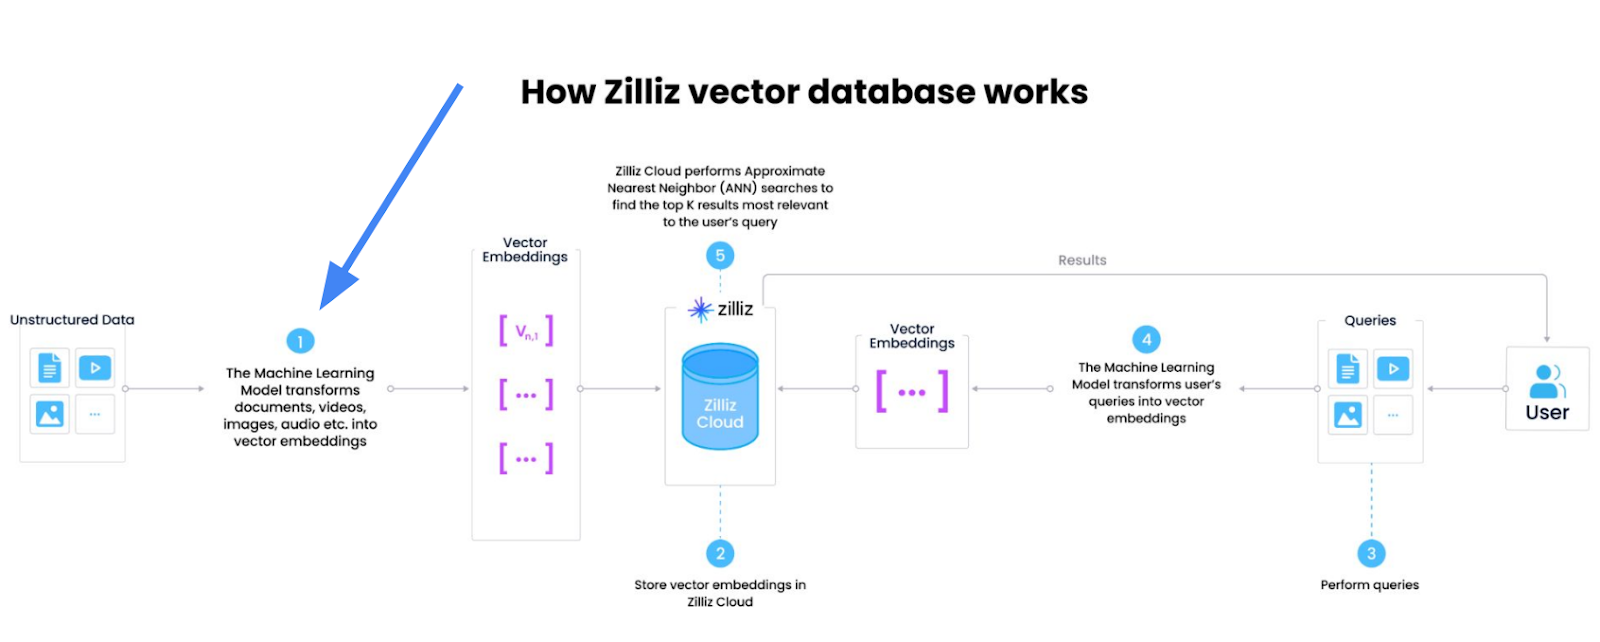
Figure: Selecting the Right Embedding Model.
Traditional embedding methods often rely on:
Public Leaderboards (MTEB): Models overfit on public data, performing poorly on real-world tasks.
Average Metrics: Metrics like NDCG@10 hide failure clusters where critical queries underperform.
Scalability Issues: Manually inspecting large datasets with 100K+ queries is impractical.
As Gabriel Alon noted during the webinar, an average score of 0.34 NDCG (Normalized Discounted Cumulative Gain) might seem acceptable, but if a substantial portion of queries score below 0.1, the model may be unsuitable for real-world applications and would risk user trust. Thus, it was highly recommended to evaluate models on your data to overcome train-test mismatch and avoid overfitting on public benchmarks.
For example, consider two models retrieving results for ‘Television Stands’:
Model A returns [Mobile TV Cart, Universal TV Stand, Black Television]
Model B returns [Mobile TV Cart, Universal TV Stand, TV Stand (2 feet)]
While Model B has higher recall, neither average metrics nor leaderboards reveal this difference.
The Solution: Navigable TDA Clustering
Topological Data Analysis (TDA) is a mathematical framework that studies the ‘shape’ of data, while navigable clustering adds flexibility to adjust hyperparameters (e.g., resolution) for granular insights. By applying TDA clustering techniques, such as the Mapper algorithm, you can create visual representations that reveal underlying structures, clusters, and outliers within high-dimensional embeddings that traditional average metrics overlook. Navigable TDA clustering extends this by:
Mapping Data Topology: Creating a graph-based structure of the embedding space.
Identifying Critical Clusters: Highlighting groups of underperforming queries for targeted improvements rather than a one-size-fits-all solution.
Automated Interpretability: Generating keywords and heat maps to explain clusters and model behavior.
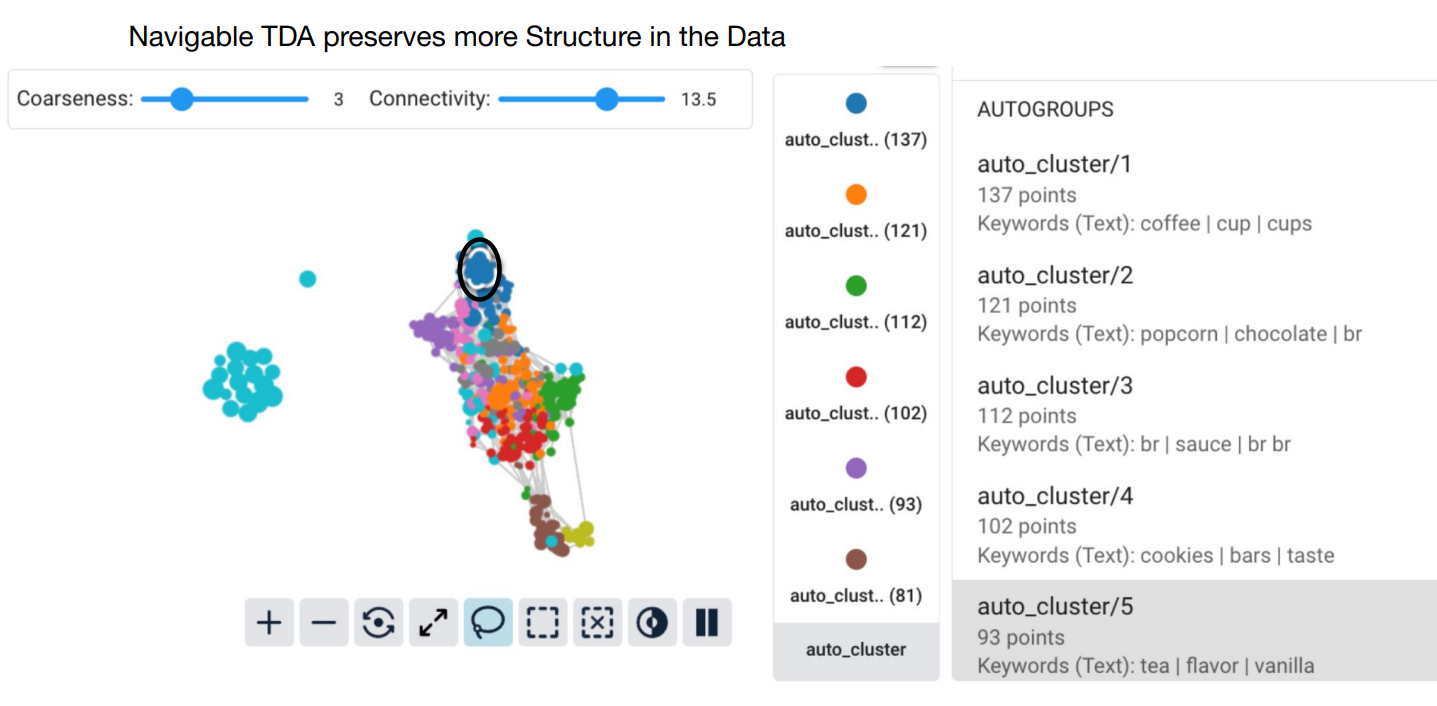
Figure: TDA Clustering Workflow: Highlighting underperforming groups.
How It Works:
Cluster Queries by Similarity: Group queries using vector embeddings.
Evaluate Per-Cluster Metrics: Calculate precision, recall, or NDCG for each cluster.
Optimize Strategically: Adjust hyperparameters or switch models for weak clusters.
Unlike static clustering methods (e.g., K-means or DBSCAN), navigable TDA clustering detects failure hotspots invisible to average metrics, objectively ranks models (E5 vs. SBERT) on your data, and processes 100K+ queries in minutes.
Case Study: E-Commerce Query Optimization
Using a subset of the Marqo-GS-10M dataset (10M Google Shopping queries), Blue Light AI uncovered severe flaws in a popular embedding model (E5). After applying TDA clustering:
| Query Cluster | Size | NDCG |
| Maternity wear | 35 | 0.10 |
| Espresso machines | 32 | 0.11 |
| Boys tracksuits | 35 | 0.13 |
Takeaways:
Despite an average NDCG of 0.34, about 30% of clusters performed far worse (<0.15).
Fine-tuning worsened performance for critical clusters.
Without TDA, these subtle flaws remain hidden.
Machine Learning Lifecycle: TDA Insights
Model Comparisons:
E5 (NDCG 0.34) outperformed SBERT (0.26) on average, but SBERT excelled in clusters like ‘novelty wallets’:
| Cluster | E5 NDCG | SBERT NDCG | Best Model |
| Novelty wallets | 0.16 | 0.28 | SBERT |
| Air mattresses | 0.38 | 0.38 | Tie |
Cost-Saving Trade-offs:
Switching from E5-large to E5-small saved storage but resulted in significant performance drops for critical clusters:
| Query Type | Performance Drop |
| Adaptive waistbands | -35% |
| Polo activities | -65% |
Fine-Tuning Pitfalls
Post-deployment monitoring revealed that fine-tuning improved the average NDCG from 0.35 to 0.45 but degraded specific clusters:
| Query Type | Performance Drop |
| Privacy films | -29% |
| Garlic peeling | -22% |
Lesson: Always validate fine-tuning at the cluster level, not just globally.
Post-Deployment Strategies
Risk Mitigation: Avoid promoting products in low-scoring clusters until models improve.
Human-in-the-Loop: Route poorly performing queries to human agents.
Model Routing: Dynamically switch models based on cluster performance (e.g., use SBERT for specific query types).
Integrating TDA with Zilliz Cloud and Milvus
Zilliz Cloud and Milvus simplify storing and querying embeddings. By applying TDA clustering, they offer improved search efficiency, interactivity, and optimized resource allocation. Here’s how to pair it with TDA:
Store Embeddings
Validate embeddings before indexing to reduce wasted resources:
from pymilvus import connections, Collection

# Connect to Zilliz Cloud

connections.connect(

    alias="default",

    uri="YOUR_CLUSTER_ENDPOINT",  # Example: "https://your-cluster.zillizcloud.com"

    token="YOUR_API_KEY"

)

# Load your collection

collection = Collection("product_embeddings")

collection.load()
Evaluate and Cluster with TDA
import pandas as pd

from sklearn.manifold import TSNE

import matplotlib.pyplot as plt

# Load embeddings from Zilliz

embeddings = collection.query(expr="", output_fields=["embedding"])

# Reduce dimensionality for visualization

tsne = TSNE(n_components=2)

embeddings_2d = tsne.fit_transform(embeddings)

plt.scatter(embeddings_2d[:, 0], embeddings_2d[:, 1], c=cluster_labels)

plt.title("T-SNE Visualization of Query Clusters")

plt.show()
Why Zilliz Excels in TDA Workflows
Scalability: Handles billions of vectors, ideal for large-scale TDA.
Real-Time Insights: Update clusters dynamically as new data streams in.
Seamless Integration: Python SDKs and REST APIs fit into existing pipelines.
For deeper insights, explore Zilliz’s vector database guide.
Best Practices for Embedding Model Development
Validate Locally: Test models on your data, rather than relying solely on benchmarks.
Adopt TDA Early: Integrate navigable clustering to catch issues during prototyping.
Monitor Post-Deployment: Use Zilliz Cloud’s tools to track cluster performance continuously.
Q&A: Key Questions from the Webinar
We received several questions during the webinar. Below are some of the most frequently asked questions, along with Gunnar and Gabriel’s responses:
Q: What surprised you most when applying TDA clustering?
Fine-tuning worsened performance for 30-40% of clusters in our case study. For example, espresso machine-related queries performed far worse after tuning. Even more critical: in e-commerce, a single query could represent a $20 product. If your model fails here, that’s real revenue lost.
Q: Have you explored fine-tuning retrieval models versus embedding models?
Yes! In RAG setups, we have used TDA to split ambiguous queries into distinct clusters. For instance, the query ‘tell me about the draft’: TDA separates results into NBA draft and military draft clusters. This helps retrieval models prioritize context, avoiding irrelevant results.
Q: How does TDA compare to methods like DBSCAN?
TDA offers flexibility through navigable hyperparameters. Traditional methods like DBSCAN operate on fixed data maps. With TDA, you adjust the ‘map resolution’ like switching between geographic projections to isolate local minima (e.g., underperforming query clusters).
Q: What’s your take on query-dependent embedding models?
TDA’s topology mapping naturally complements this trend. For example, sparse autoencoder features from models like OpenAI’s reveal clusters that traditional methods miss. One case splits ‘rules’ into compliance vs. breaking rules clusters, showing how embeddings can adapt to query context.
Q: How can teams get started with TDA?
Try out the Python package Cobalt by running pip install cobalt-ai and exploring the documentation and resources on GitHub and Slack to help troubleshoot. This package simplifies integrating TDA clustering into existing workflows. It processes 100K queries in minutes and integrates with Zilliz.
Conclusion
The webinar offered a thorough overview of how TDA clustering can transform embedding model evaluation. By revealing detailed performance breakdowns through navigable clustering, teams can optimize model selection, improve resource allocation, and enhance user experiences. When paired with Zilliz Cloud or Milvus, these insights lead to:
Transparency: Uncover hidden flaws in embeddings.
Precision: Deploy models with granular performance insights.
Cost Savings: Reduce wasted compute and storage resources.
Explore Zilliz Cloud to start clustering smarter today.
View the Complete Webinar Recording and Slides
You can watch the webinar recording on Zilliz’s YouTube channel and access the presentation slides for further insights on Topological Data Analysis (TDA) clustering and the discussion between Gunnar and Gabriel.
Related Resources
- The Challenge: Evaluating Embedding Models
- The Solution: Navigable TDA Clustering
- Case Study: E-Commerce Query Optimization
- Machine Learning Lifecycle: TDA Insights
- Integrating TDA with Zilliz Cloud and Milvus
- Why Zilliz Excels in TDA Workflows
- Best Practices for Embedding Model Development
- Q&A: Key Questions from the Webinar
- Conclusion
- View the Complete Webinar Recording and Slides
- Related Resources
Content
Start Free, Scale Easily
Try the fully-managed vector database built for your GenAI applications.
Try Zilliz Cloud for FreeKeep Reading
Will Amazon S3 Vectors Kill Vector Databases—or Save Them?
AWS S3 Vectors aims for 90% cost savings for vector storage. But will it kill vectordbs like Milvus? A deep dive into costs, limits, and the future of tiered storage.
The Great AI Agent Protocol Race: Function Calling vs. MCP vs. A2A
Compare Function Calling, MCP, and A2A protocols for AI agents. Learn which standard best fits your development needs and future-proof your applications.
Similarity Metrics for Vector Search
Exploring five similarity metrics for vector search: L2 or Euclidean distance, cosine distance, inner product, and hamming distance.
