Understanding K-means Clustering Algorithm in Machine Learning
K-means clustering or K-means algorithm or, K-means clustering algorithm—well, before we dive into what clustering algorithms are all about, we need to understand how essential they are for modern-day enterprises to make sense of data—data about products, data about customers, data about transactions, and so on.
In a world where technology is redefining the business landscape, enterprises spend millions of dollars analyzing data to develop patterns that help them become more efficient and boost their profits. Grouping objects together based on attributes is one of the first tasks involved in this process of coming up with such patterns.
Grouping objects helps enterprises design various strategies for various situations. Customers, products, and transactions are objects of core interest in such processes. Grouping customers based on their behavior helps businesses design personalized offerings. Grouping products helps them offer alternate choices to customers. And grouping transactions helps them identify unusual patterns that require closer attention.
This is where clustering comes in. Clustering is an unsupervised machine learning (ML) algorithm that groups objects based on attributes.
This comprehensive article from Zilliz, a leading vector database company for production-ready AI, will take you deep into what K-means clustering algorithm in machine learning is all about and how you can implement it using Python. It will also explore when to use K-means clustering algorithm and give a real K-means clustering example.
What Is Clustering?
Clustering is the process of grouping data points so that each element in a particular group is more similar to the elements in that group than elements in other groups. Clustering doesn't refer to a specific algorithm. It is a generic task that can be solved by using many algorithms. Clustering algorithms generally define a metric to quantify the similarity systematically. Clustering is used in many fields, such as image processing, information retrieval, recommendation engines, and data compression.
Clustering establishes similarity based on the attributes of the objects it clusters. The attributes differ according to the domain. For example, in the case of an image, the attributes are pixel values. In the case of a user profile, the attributes are details such as age, gender, and purchase history. In the case of a product, the attributes are the category, color, price, etc. Clustering is called an unsupervised task because there is no user-monitored training process that involves preparing labeled data.
How Do Clustering Algorithms Work?
Most clustering algorithms work by computing the similarity between all pairs of samples. Each data point is assigned to the nearest centroid based on distance calculations, which is a fundamental step in the clustering process.
The ability to scale to the volume of the data set is an essential factor to consider while deciding on the clustering algorithm for a problem. The time of execution increases with the number of pairs of elements. In extreme cases, it can vary proportionally to the square of the data volume.
Four Approaches to Clustering
There are four common approaches to clustering: centroid-based, density-based, hierarchical, and distribution-based. Let's have a look at them, one by one.
1. Centroid-Based Clustering
This method organizes data points into individual clusters without any hierarchy based on the centroid of all the data points in cluster. The centroid is the geometric center of an object. In simple words, it is the arithmetic mean of all the points that constitute that object in n-dimensional space. Here, a cluster is a collection of points located around a centroid. Centroid-based clustering suffers from issues related to initial assignments and outliers.
2. Density-Based Clustering
As the name suggests, it computes the density of points in an area and then assigns data points to clusters wherever high density is found. In this case, the clusters can take any shape. Density-based clustering faces issues when the data inherently has a high variance in density. It does not perform well when the data dimension is high, as it can struggle to distinguish between clusters and neighboring clusters.
3. Hierarchical Clustering
This method provides a tree of clusters with the possibility of clusters located inside larger clusters. This method fits in well when data exhibits an inherent hierarchy. Hierarchical clustering allows choosing any number of different clusters after the execution since the analyst can break the tree at the required point and consider only clusters after that point.
4. Distribution-Based Clustering
This method uses the concept of probability distributions to find clusters. It assumes that the probability of a point being in a cluster decreases when the distance from the cluster center increases. Developers should know the distribution of their data to use this method effectively.
What is K-means Clustering?
K-means clustering algorithm is a centroid-based clustering algorithm. It is an unsupervised learning algorithm since it does not rely on labeled data. The ‘K’ in a K-means clustering algorithm represents the number of clusters.
K-means is an iterative algorithm that computes the mean or centroid many times before converging. The time to converge depends on the initial assignment and optimal number of clusters used. Generally, the time complexity of K-means is

where d is the number of dimensions, k is the number of clusters, and n is the number k clusters of data elements.
The K-means clustering algorithm works by calculating the distance of each data element from the geometric center of a cluster. It then reconfigures the cluster if it finds a point belonging to a specific cluster closer to the centroid of another cluster. After that, it recomputes the cluster centroid and repeats the process till there is no further cluster reassignment.
Let us look at how the algorithm works.
How Does K-means Clustering Algorithm Work?
The K-means clustering algorithm is an iterative process involving four major steps. To understand these steps, let us consider a two-dimensional clustering problem. Let us assume the points are (x1,y1),(x2,y2), and so on. Let us begin with a cluster size of 2.
Initial Assignment
This step assigns each point to an arbitrary cluster. One option is to assign random points as cluster centroids and compute the distances between each data point and the centroids.
Points are assigned to the cluster whose centroid is closest to them. The distance between two clusters is computed using the Euclidean distance formula. For example, if x3,y3 is one of the randomly assigned centroids, one can calculate the distance between x1,y1 and x3,y3 using this formula:

 Y vs. X
Y vs. X
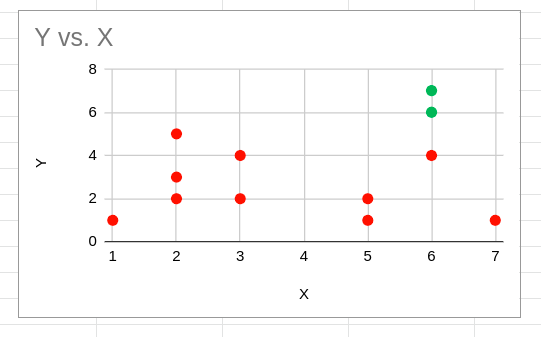
The red and green points denote the initial random centroid assignments. Based on these initial cluster centroids alone, the initial cluster assignment will appear as shown below:
 Y vs. X
Y vs. X
Calculating Centroids
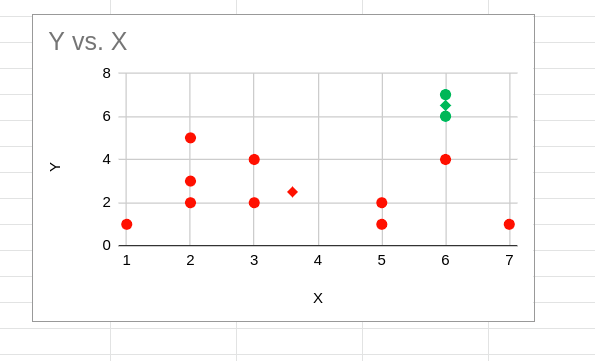
This step involves recalculating the centroids for each cluster. The centroid for a cluster is calculated by using the arithmetic mean of all elements in that cluster. For example, let us say x1,y1, x2,y2, and x3,y3 belong to a cluster. The centroid of that cluster is calculated as:

The points in a diamond shape, as shown below, become the new centroids.
 Y vs. X
Y vs. X
Reassigning Clusters
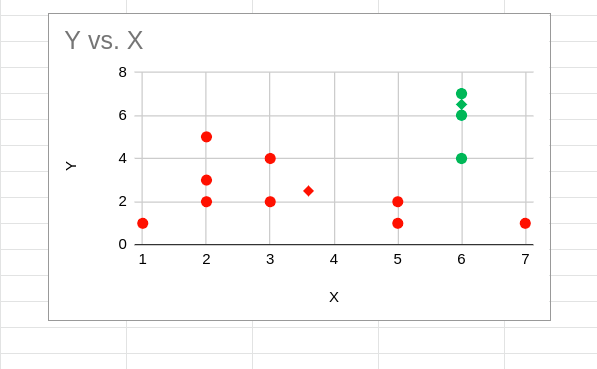
Once new centroids for all three clusters are found, the distance between each point and the new centroids is recalculated. If any of the points is located closer to the centroid of a cluster that it is currently assigned, the points are reassigned.
 Y vs. X
Y vs. X
Convergence
After the reassignment of clusters, centroids are calculated again, and the process repeats. Calculating centroids and reassigning clusters are executed till there are no further new reassignments. The converged clustering task, in this case, will appear as shown below:
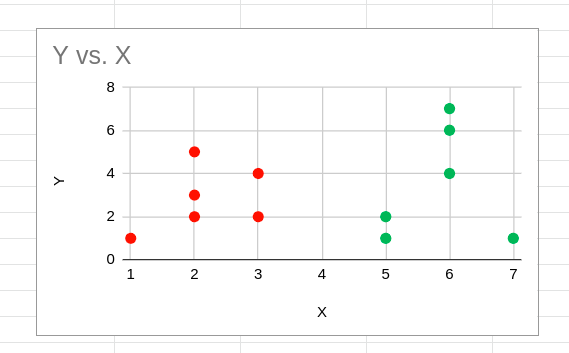 Y vs. X
Y vs. X
Choosing the Number Of Clusters
Two commonly used methods for choosing the ideal number of clusters are the elbow method and the silhouette method.
Elbow Method
Elbow Method computes a metric called WCSS (Within Cluster Sum of Squares). WCSS is the sum of squares of the distance of each point from the centroid of its nearest cluster above. The plot of WCSS with respect to the number of clusters is used as the indication to select the optimum number of clusters.
Developers execute K-means clustering for cluster counts of 1 to n and then compute WCSS for each of these runs. WCSS will be highest for a single cluster execution and comes down when the number of clusters goes up. The point where WCSS exhibits a sharp bend, like the elbow of an arm, is considered the ideal optimal number of clusters.
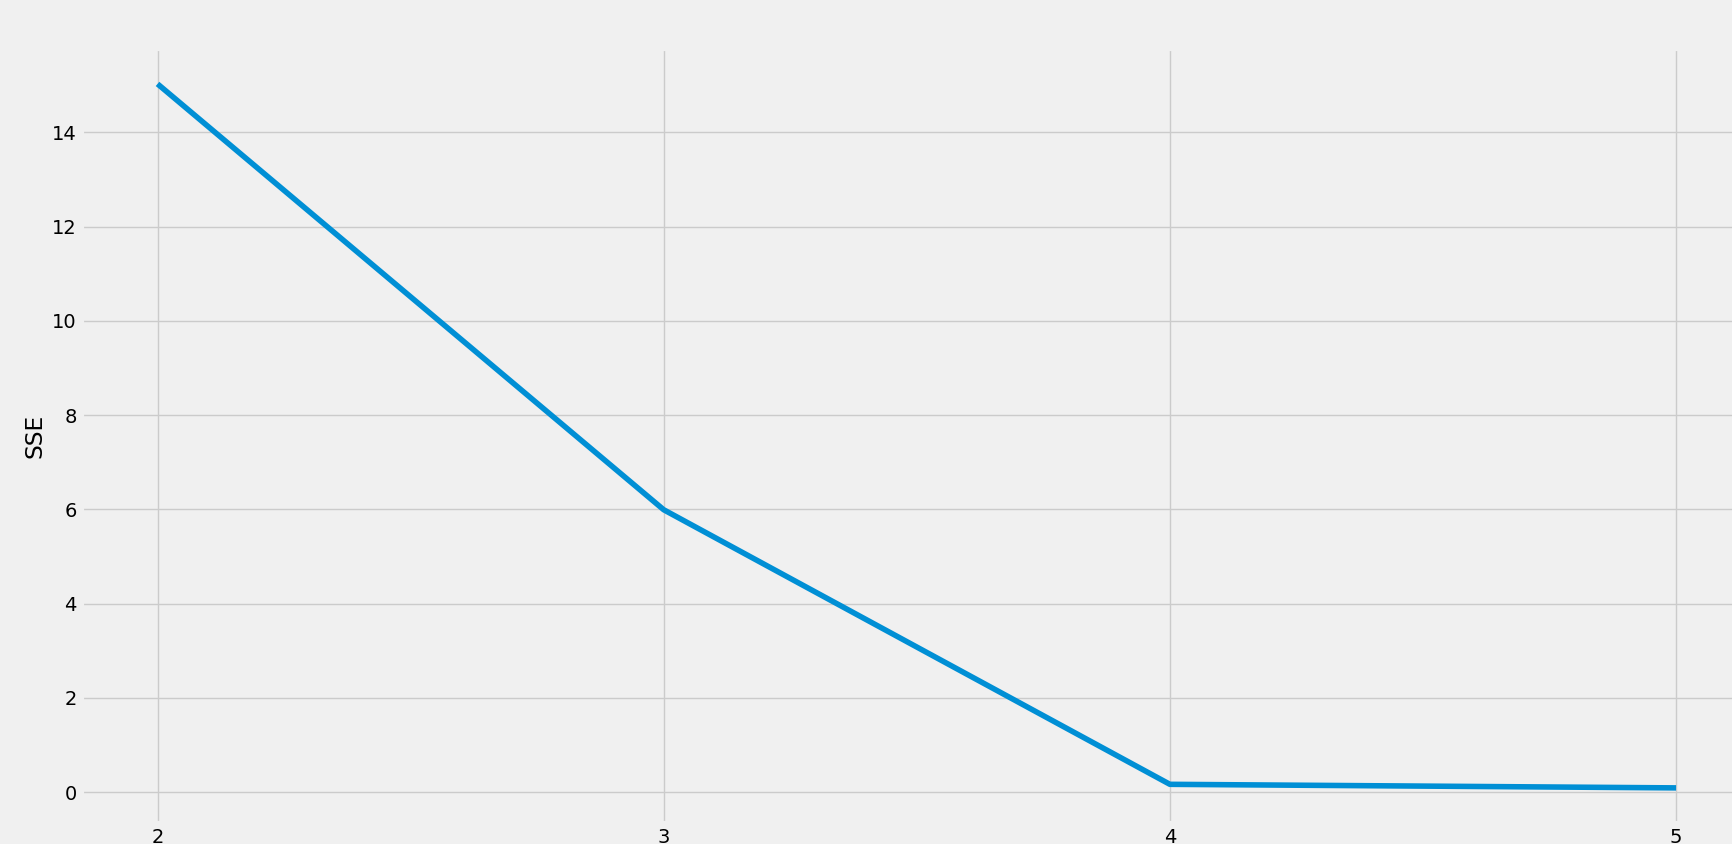 Elbow Method
Elbow Method
Silhouette method
This method tries to understand the extent of similarity of an object with other members of the same cluster and the extent of separation of the objects from other clusters. The silhouette score for a point is calculated by combining the average distance of that point from other points in the cluster (a) and the average distance of that point with all the points that belong to other clusters (b), including neighboring clusters. Once a and b are found, the silhouette score for a point is computed as

The score for each point is then averaged to find the silhouette score. The score is calculated for all candidates for the optimum count and then the one with the k points and the highest score is selected as the optimum count.
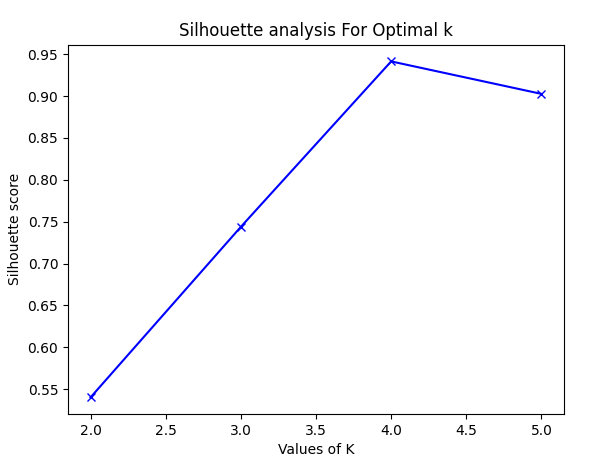 Silhouette Method
Silhouette Method
A Real Example of K-means Clustering Algorithm (Implementing K-means Clustering with Python)
This tutorial demonstrates how to implement K-means clustering using Python and to find the optimal cluster size. To do this, let us assume a problem statement common in the e-commerce domain. Clustering customers based on their demographic attributes and spending habits is a common task in the e-commerce domain. For simplifying the K-means clustering example, we will use two attributes here: the age of the customer and the average amount spent per month.
- To do this, let us use a Python machine learning library called scikit-learn and a plotting library called matplotlib. First, initialize the libraries using the import statements given below:
import matplotlib.pyplot as plt
import numpy as np
from sklearn.cluster import KMeans
from sklearn.metrics import silhouette\_score
from sklearn.preprocessing import StandardScaler
- The next step is to define the input data frame. Here, the first attribute is the age and the second attribute is the average monthly spend in Indian Rupees (INR). For simplicity, let us initialize the array in the code itself. We have 16 data points here:
raw\_features = np.array([[22,200],[24,200],[24,200],[20,800],[24,800],[24,800],[25,200],[54,200],[24,200],[54,200],[50,800],[53,800],[24,800],[55,800],[53,800],[50,800]])
- You will then normalize the data points, so that variation in one attribute does not overshadow variations in other attributes.
scaler = StandardScaler()
features = scaler.fit\_transform(raw\_features)
- Implement a for loop to try out K-means clustering for the number of clusters varying from 2 to 6. We will then compute the sum of squares and plot it against the number of clusters to identify the optimum number of clusters.
sse = []
s\_scores=[]
for i in range(2,6):
kmeans = KMeans(init = **"random"** ,n\_clusters = i,n\_init = 10,max\_iter = 300,random\_state = 42)
kmeans.fit(features)
sse.append(kmeans.inertia\_)
s\_scores.append(silhouette\_score(features, kmeans.labels\_))
- Use the matplotlib library to plot the sum of squares against the number of clusters.
plt.style.use( **"fivethirtyeight"** )
plt.plot(range(1, 6), sse)
plt.xticks(range(1, 6))
plt.xlabel( **"Number of Clusters"** )
plt.ylabel( **"SSE"** )
plt.show()
- Running the above code will result in a plot that we can use to identify the optimum number of clusters.
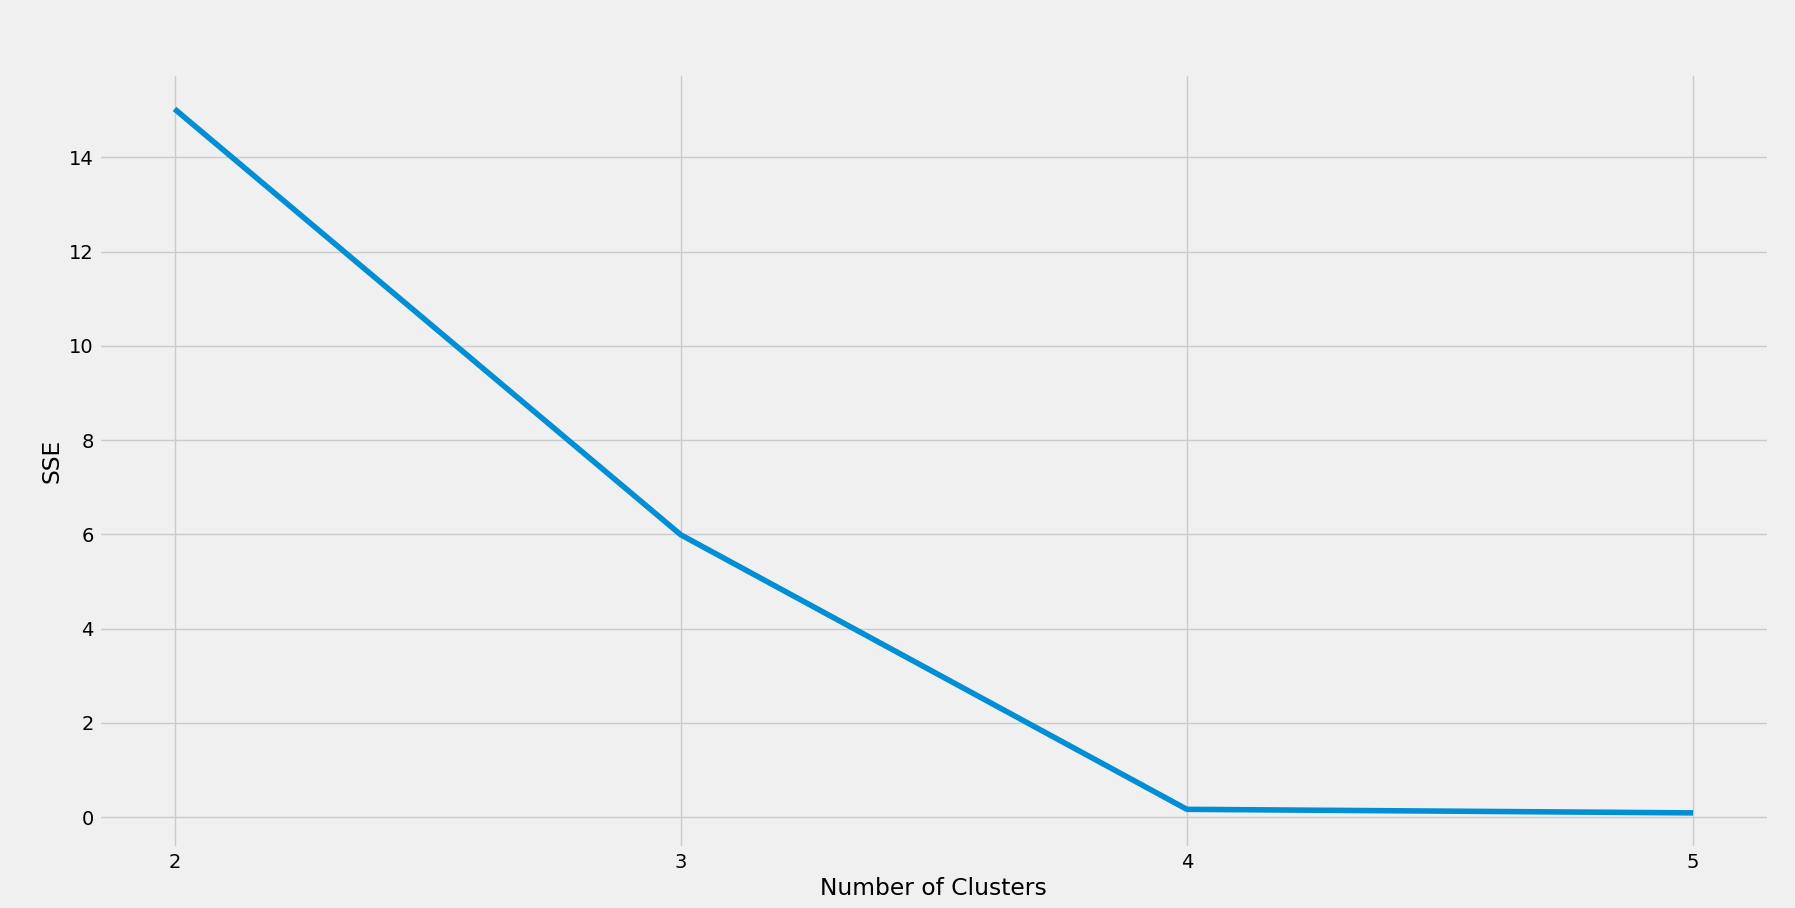 K-means clustering
K-means clustering algorithm
The scatter plot above shows a distinct 'elbow' at 4. So the optimum number of clusters here is 4. With some domain knowledge, a data scientist can explain this number as four combinations - Low Age High Spend, Low Age Low Spend, High Age High Spend, and High Age Low Spend customers. But such explanations may not always be possible, and the optimum number of clusters varies based on problem specifications.
That's all there is to running K-means clustering in Python. The scikit-learn and matplotlib frameworks make it very easy to use clustering in Python.
When to use K-Means Clustering Algorithm
So, as we've learnt, clustering is an unsupervised machine learning algorithm that helps to group objects based on similarity. It is widely used in many industry domains for exploratory data analysis.
It is useful in areas such as customer segmentation, recommendation engines, and similarity search. That said, K-means clustering algorithm is not the only technique that can be used to solve these problems. Another way to solve such a problem is to generate vector embeddings for each object based on their attributes.
Deep learning-based training networks can generate multi-dimensional embeddings for objects with a large number of attributes. These embeddings, coupled with a good vector database, can solve similarity-based problems with much better control.
If you're working on such problems, check out Zilliz. It offers a one-stop solution for challenges in handling unstructured data, especially for enterprises that build AI/ML applications that leverage vector similarity search.
Zilliz created Milvus, a popular open-source vector database that is widely recognized by over a thousand enterprise users worldwide. The company also offers a fully-managed vector database service, Zilliz Cloud, that enables enterprises to experience the full power of Milvus without the hassle of building and managing infrastructure.
If you want to know: what is a vector database? - you can check out the in-depth guide. Looking for more information about related topics? Check out this explanation of Approximate Nearest Neighbor Search (ANNS). Want to learn more about how Zilliz can help you? All you have to do is click here and ask!
- What Is Clustering?
- How Do Clustering Algorithms Work?
- Four Approaches to Clustering
- What is K-means Clustering?
- How Does K-means Clustering Algorithm Work?
- Choosing the Number Of Clusters
- A Real Example of K-means Clustering Algorithm (Implementing K-means Clustering with Python)
- When to use K-Means Clustering Algorithm
Content
Start Free, Scale Easily
Try the fully-managed vector database built for your GenAI applications.
Try Zilliz Cloud for FreeKeep Reading

Milvus 2.6.x Now Generally Available on Zilliz Cloud, Making Vector Search Faster, Smarter, and More Cost-Efficient for Production AI
Milvus 2.6.x is now GA on Zilliz Cloud, delivering faster vector search, smarter hybrid queries, and lower costs for production RAG and AI applications.
Smarter Autoscaling in Zilliz Cloud: Always Optimized for Every Workload
With the latest upgrade, Zilliz Cloud introduces smarter autoscaling—a fully automated, more streamlined, elastic resource management system.

Zilliz Cloud BYOC Upgrades: Bring Enterprise-Grade Security, Networking Isolation, and More
Discover how Zilliz Cloud BYOC brings enterprise-grade security, networking isolation, and infrastructure automation to vector database deployments in AWS
