


Observability: Tracking Beyond Monitoring
Observability: Tracking Beyond Monitoring
What is Observability?
Observability means understanding what’s happening inside a system based on the data it produces. Think of it as the ability to "look inside" a software system and understand its state and behavior. It helps answer questions like, “Is everything working as expected?” or “Why is something going wrong?” Instead of guessing what’s causing issues, observability provides clear insights through data like logs, metrics, and traces.
Why Observability Matters?
Modern software systems are getting more complex. With the rise of technologies like microservices, cloud computing, and containerization, systems are now made up of many interconnected parts that can be spread across different locations. This makes them hard to monitor and troubleshoot.
Traditional monitoring tools often fall short—they may tell you something’s wrong but not why. Observability fills this gap by providing visibility into the internal state of systems to identify problems quickly.
Core Pillars of Observability
Observability has three pillars that work together to provide a clear picture of what’s happening inside a system. Let's break them down:
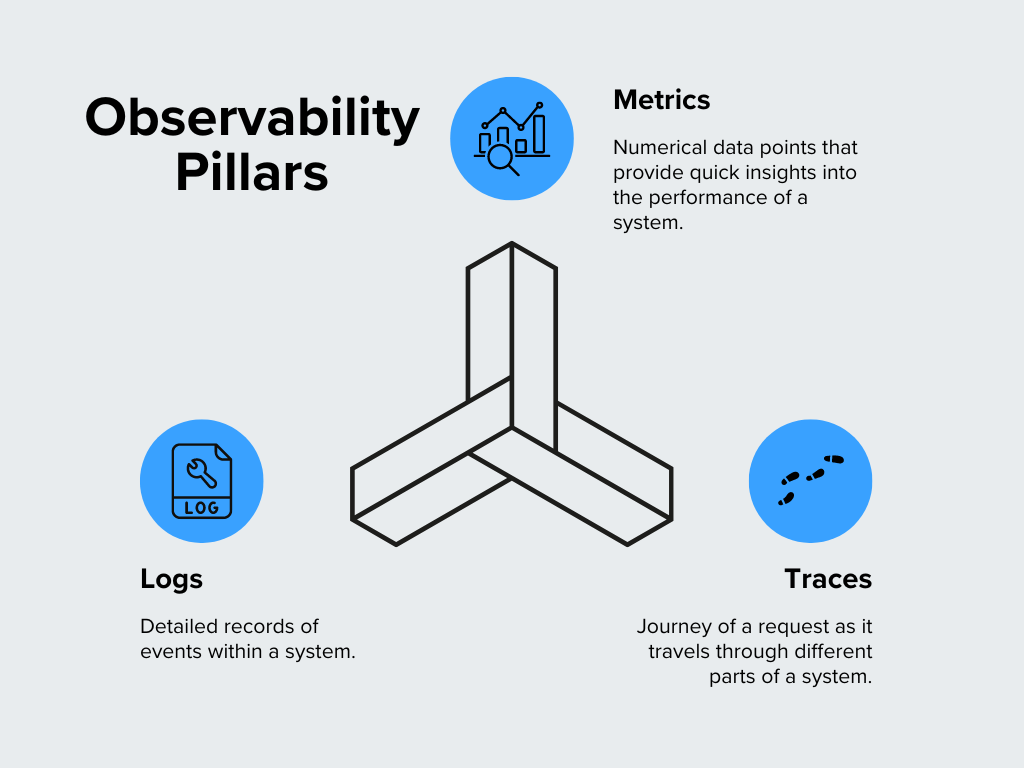 Figure- Pillars of Observability.png
Figure: Pillars of Observability
Metrics
Metrics are numerical data points that provide quick insights into a system's performance. They are your system's vital signs that show how things are functioning. Common metrics include CPU usage, memory consumption, request rates, and response times. For example, if you notice an unusual spike in CPU usage, it may indicate a problem that needs attention. Metrics are great for identifying trends and seeing how a system behaves over time.
Logs
Logs are detailed records of events within a system. Think of them like a diary that captures what happens inside your software. Whenever an error occurs, a user logs in, or a transaction is processed, it is usually recorded in a log. Logs provide context for diagnosing issues and understanding system behavior. For example, when something goes wrong, logs can help pinpoint what happened right before and after the problem occurred.
Traces
Traces follow the journey of a request as it travels through different parts of a system. In a complex setup with multiple services working together, a trace shows you the path taken by a single request and how much time it spends in each service. Traces identify bottlenecks or delays in the process. If you find a request taking longer than expected, traces can help you see where the slowdown is happening.
How Observability Works?
Observability follows a few important steps. Here's how it works:
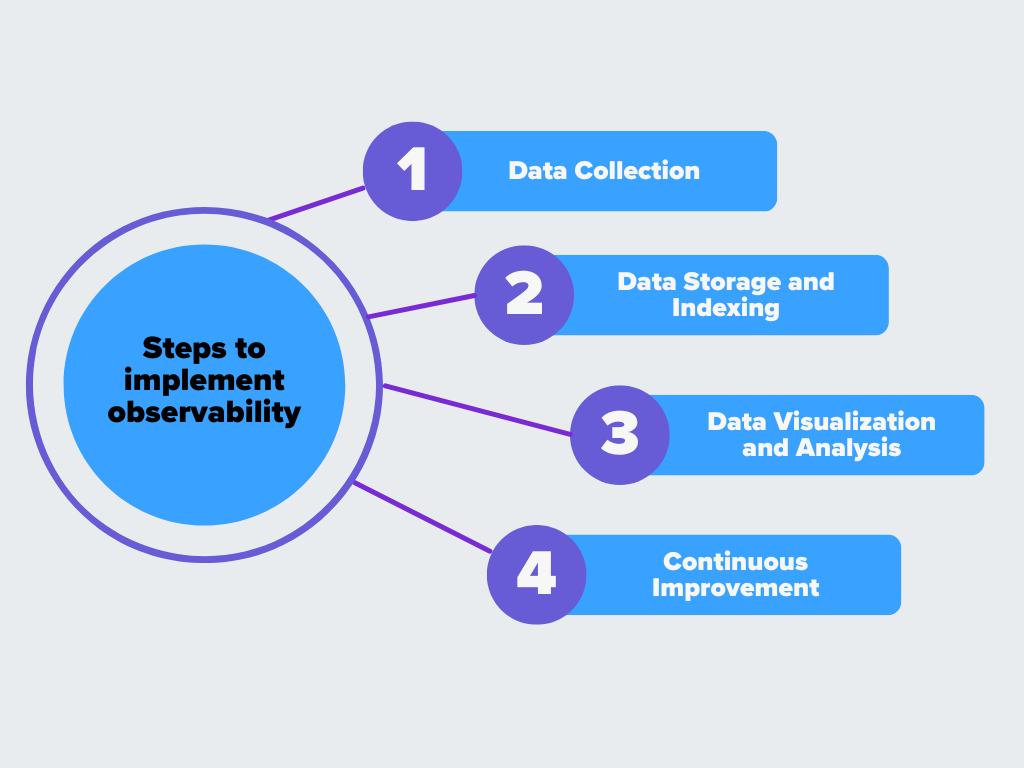 Figure- Steps to implement observability.png
Figure: Steps to implement observability
Data Collection
The first step is gathering data from all parts of the system. This includes collecting metrics (like
CPU usage), logs (detailed event records), and traces (the path requests taken through services). The goal is to capture everything that can offer insights into the system’s performance, issues, or general behavior. This data comes from various sources, such as servers, applications, databases, and user interactions.
Data Storage and Indexing
After the data is collected, it must be stored efficiently. Proper storage means you can quickly find and use the data when needed. Indexing the data helps search for and retrieve specific pieces of information faster. For example, when an issue arises, engineers should be able to easily pull up the logs or metrics related to that incident without delays. Good storage practices are crucial for keeping data organized and accessible.
Data Visualization and Analysis
Collecting data is one thing, but making sense of it is another. Visualization tools and dashboards play a vital role here. They turn raw data into easy-to-understand graphs, charts, and alerts. Visualization helps teams quickly see trends, patterns, or any unusual behavior in the system. Dashboards make it easy to spot performance issues and drill down into the details if something seems off. Alerting systems can also notify teams in real time when metrics cross certain thresholds or when errors occur.
Continuous Improvement
The data from observability is not just for fixing problems but also for improving the system. By regularly reviewing the collected data, teams can identify areas that need improvement or optimization. The continuous feedback loop incorporates enhancements so that the system runs more efficiently. Observability data can guide decisions on scaling resources, which improves the user experience and prevents future problems.
Use Cases of Observability
Observability has a strong impact on real-world applications. Here are some practical use cases that show how observability makes a difference:
Performance Monitoring in Distributed Systems
Performance issues can be tough to identify in a distributed system with multiple services working together. Observability helps by providing metrics, logs, and traces that give a clear picture of how different services interact. For example, if a single microservice slows down the entire application, observability tools can quickly highlight which service is causing the lag.
Debugging and Troubleshooting Failures
When a system breaks, teams figure out what went wrong. Observability makes this process much easier by providing detailed logs and traces of events. For instance, if a server crashes or a request fails, the logs can show exactly what happened right before the failure. Traces help teams see how the issue travels across different services.
Reliability and Availability
Observability plays a big role in meeting service-level objectives (SLOs) and service-level agreements (SLAs). These are commitments about how reliable and available a system should be. By keeping track of system health through metrics and alerts, teams can meet these targets. For example, if response times start getting slower, observability helps teams act before users are affected, maintaining a reliable service.
Capacity Planning and Scaling
As systems grow, they need more resources like servers or memory. Observability helps in capacity planning by tracking metrics that show how the system is being used. For example, monitoring CPU usage or database load over time can help predict when more capacity is needed. With capacity planning and scaling, the system performs well without surprises.
Proactive Issue Detection
One of the best uses of observability is catching problems before they become major issues. Real-time monitoring and alerting enable teams to detect unusual patterns or spikes, like increased error rates or response times. The proactive approach can prevent downtime and keep a smooth user experience. For instance, if observability tools detect a memory leak early, teams can fix it before it crashes the system.
User Experience Monitoring
Observability is not just about the backend; it can also track user interactions and behavior. Monitoring user experience metrics like page load times, button response times, and error messages helps teams identify and fix user-facing issues quickly. For example, if a new feature causes pages to load slower, observability data will show this right away.
Cost Optimization in Cloud Environments
Cloud environments often involve pay-as-you-go pricing, meaning you're charged for the resources you use. Observability can help teams optimize costs by tracking which parts of the system use the most resources. For example, if a certain microservice consumes a large amount of bandwidth, observability tools can pinpoint this, allowing the team to optimize or refactor the service to reduce costs.
Tools and Technologies for Observability
Prometheus is an open-source monitoring tool that collects and stores metrics as time series data. It is widely used for system and application performance monitoring through its flexible querying capabilities.
Grafana is a visualization tool often paired with Prometheus. It creates interactive dashboards that help visualize Prometheus metrics, interpret data easily, monitor trends, and set up alerts for system behavior.
Jaeger is a distributed tracing tool that helps track requests as they flow through microservices. It also helps track latencies and identify bottlenecks in complex, distributed systems.
AWS CloudWatch is Amazon’s monitoring and observability tool that tracks metrics, collects logs, and provides alerting for AWS cloud resources. It integrates well with other AWS services to monitor and manage your infrastructure.
Google Cloud Monitoring offers visibility into applications and services running on Google Cloud. It offers metrics, dashboards, and alerts to monitor the health and performance of cloud resources.
Azure Monitor is a tool that provides full observability into Azure cloud resources and applications. It collects metrics, logs, and traces to help teams analyze performance and quickly resolve issues.
Modern observability tools use AI and machine learning to detect anomalies and predict future issues. These advanced tools can automatically identify patterns and alert teams to unusual behavior.
Observability Challenges
Scalability and Data Volume
Collecting, storing, and processing large amounts of metrics, logs, and traces can become challenging in a growing system. Efficient data management and scalable storage solutions are key to handling this growth.
Data Overload
Too much data can overwhelm teams and make it hard to find useful insights. To avoid noise, it's important to filter and focus on actionable data that directly helps diagnose and solve problems rather than tracking every minor detail.
Integration Across Services
Modern systems often use multiple tools and components. Proper integration is required to maintain seamless observability across these different services. Without it, critical information can be missed, and time can be wasted jumping between tools.
Observability Best Practices
To utilize the benefits of observability to its best, make sure to follow the best practices like:
Building with Observability in Mind
From the start, design systems to be easily observable. Embed metrics, logs, and traces into your architecture to make tracking and understanding system behavior easier. This proactive approach simplifies future troubleshooting and performance tuning.
Unified View Across Systems
Consolidate all observability data into one platform or dashboard. A unified view helps teams quickly identify issues and gain a holistic understanding of how different services are interacting, reducing the time spent on piecing together information from multiple sources.
Alerting and Notification Strategies
Set up alerts that are clear, meaningful, and actionable. Avoid alert fatigue by only targeting critical events tied to specific, necessary actions. The goal is to inform the team effectively, not overwhelm them with noise.
Observability vs. Monitoring
Although often mentioned together, observability and monitoring are not the same. The table below highlights the major differences between the two:
| Aspect | Observability | Monitoring |
|---|---|---|
| Purpose | Provides a deeper understanding of the system’s internal state. | Tracks specific metrics to detect issues or anomalies. |
| Data Collected | Gathers metrics, logs, and traces for detailed analysis. | Collects predefined metrics like CPU usage, memory, and errors. |
| Approach | Exploratory; helps understand "why" an issue happened. | Reactive; notifies when a known problem occurs. |
| Scope | Focuses on overall system behavior and performance insights. | Focuses on individual metrics to measure system health. |
| Issue Resolution | Helps identify unknown issues and root causes quickly. | Alerts to known issues but may lack context for deeper analysis. |
| Real-Time Analysis | Supports real-time data analysis to track system behavior live. | Relies on pre-set checks and thresholds, often with delayed context. |
| Data Flexibility | Allows for flexible, deep exploration of data beyond predefined metrics. | Monitors specific, pre-selected metrics without broader context. |
Observability and Monitoring differences
Observability in Milvus and Zilliz Cloud: Track Vector Database Performance
Milvus is an open-source vector database designed to handle billion-scale unstructured data efficiently. It is ideal for semantic search, similarity search, and GenAI apps. Observability plays a crucial role in managing and optimizing the performance of Milvus. Using observability practices, you can ensure that your vector database is running smoothly and effectively, whether it's for real-time recommendations or retrieval-augmented generation (RAG) tasks.
The open-source Milvus integrates Prometheus to monitor its performance and Grafana to visualize all the metrics. Milvus integrates seamlessly with Prometheus through:
Prometheus Endpoint: Gathers data from various exporters.
Prometheus Operator: Streamlines the management of Prometheus monitoring setups.
Kube-Prometheus: Simplifies full Kubernetes cluster monitoring for robust operation.
With Prometheus, you can track critical metrics of Milvus performance such as query response times and resource usage (CPU, GPU, and memory), enabling proactive issue resolution and system optimization. In addition, integrating Prometheus with Grafana further enhances your monitoring framework, providing detailed dashboards for in-depth analysis and efficient maintenance of Milvus deployments tailored to GenAI and similarity search applications.
For comprehensive guidance on setting up Prometheus for Milvus and visualizing metrics with Grafana, explore the resources below:
How to Spot Search Performance Bottleneck in Vector Databases using Prometheus and Grafana
Visualize Milvus Metrics with Grafana | Milvus Documentation
Zilliz Cloud is the managed version of Milvus with more advanced features and 10x higher performance. It provides even clearer and easier monitoring and observability functionalities. Zilliz Cloud has recently introduced robust monitoring and observability features to help users track vector database performance. The Metrics dashboard provides an overview of cluster health, including resource usage (CPU, memory, storage), performance (QPS, VPS, latencies), and data metrics (collection and entity counts), all customizable for deeper analysis. The dashboard presents the metrics in a very intuitive way for quick insights.
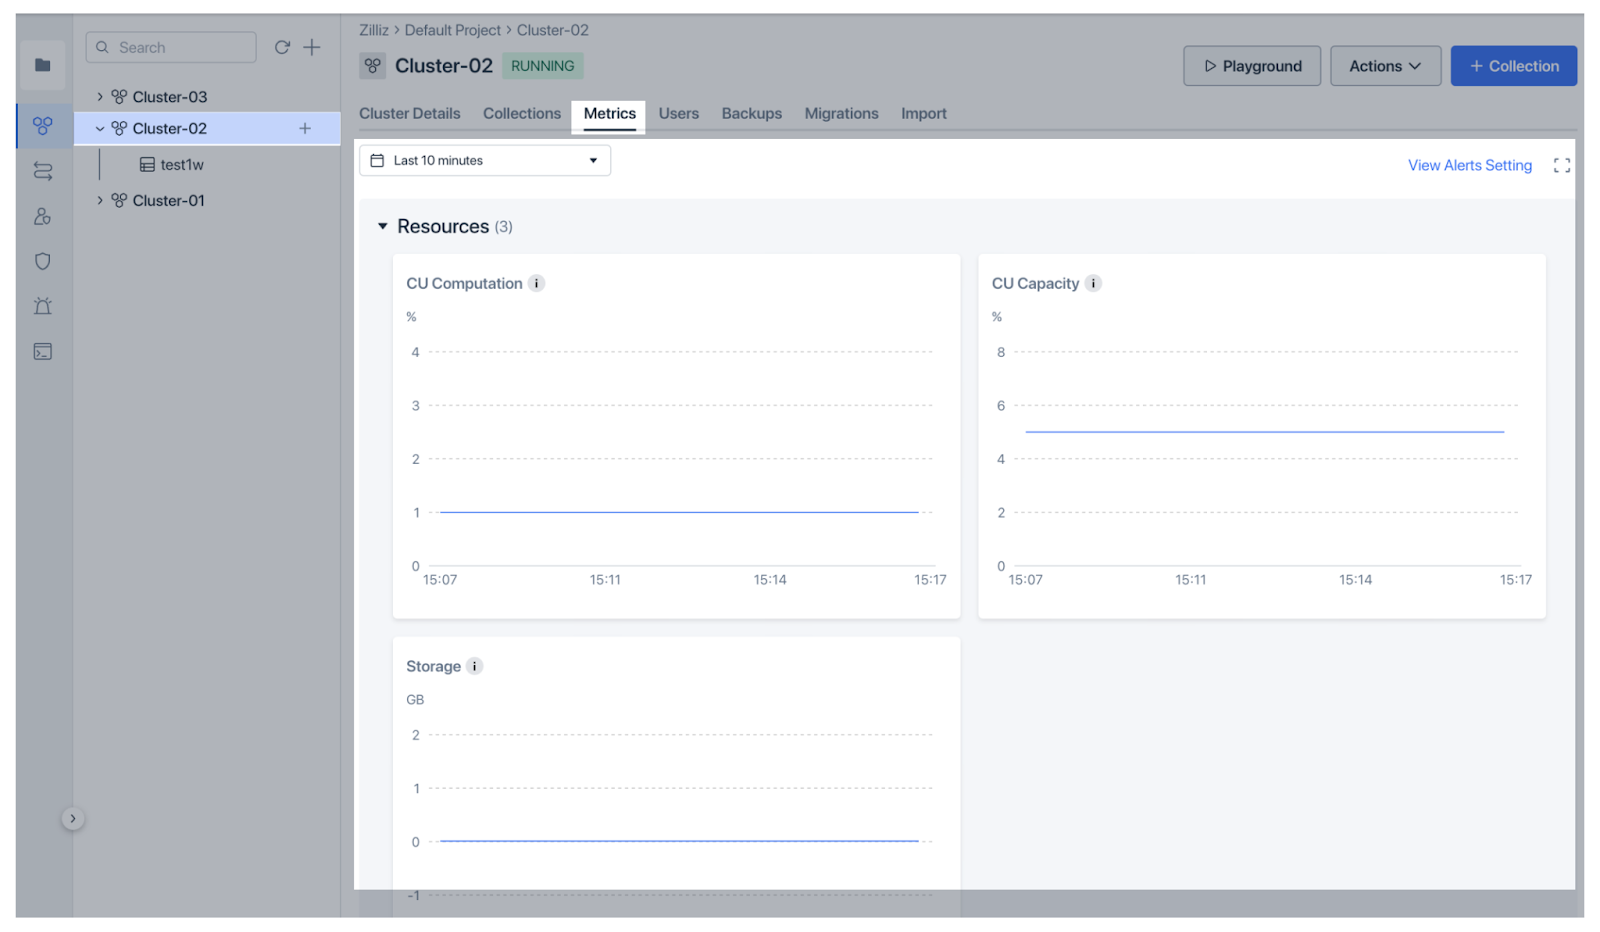 Figure: Zilliz Cloud Monitoring Metrics
Figure: Zilliz Cloud Monitoring Metrics
To catch issues early, Zilliz Cloud offers Organization Alerts for billing matters and Project Alerts for operational factors like CU usage and latency, with flexible thresholds and severity settings.
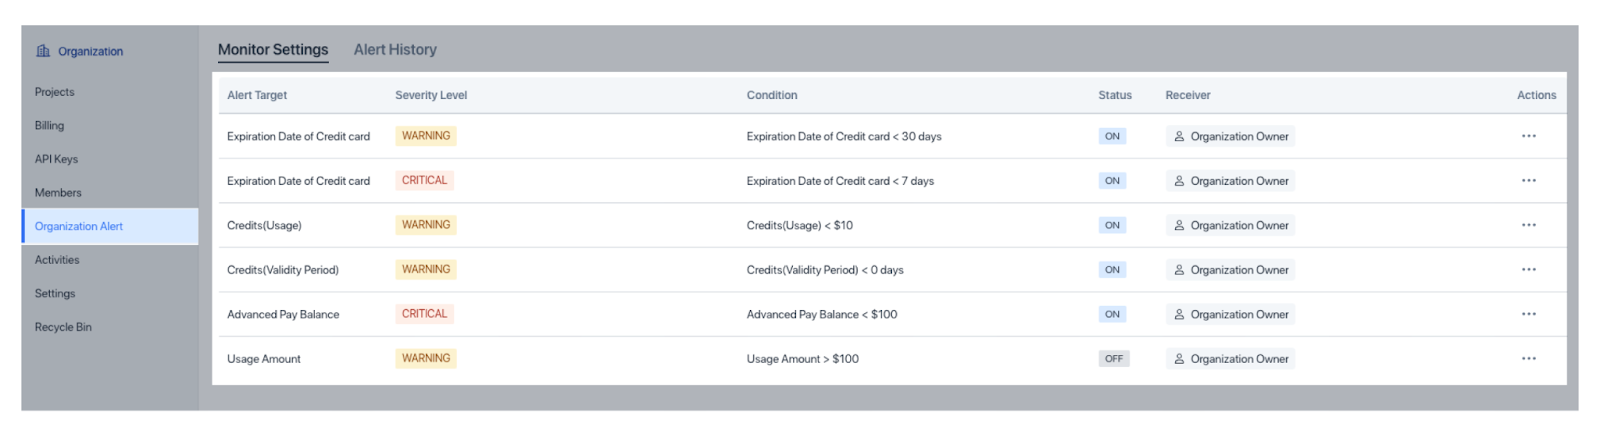 Figure: Organization alerts in Zilliz Cloud
Figure: Organization alerts in Zilliz Cloud
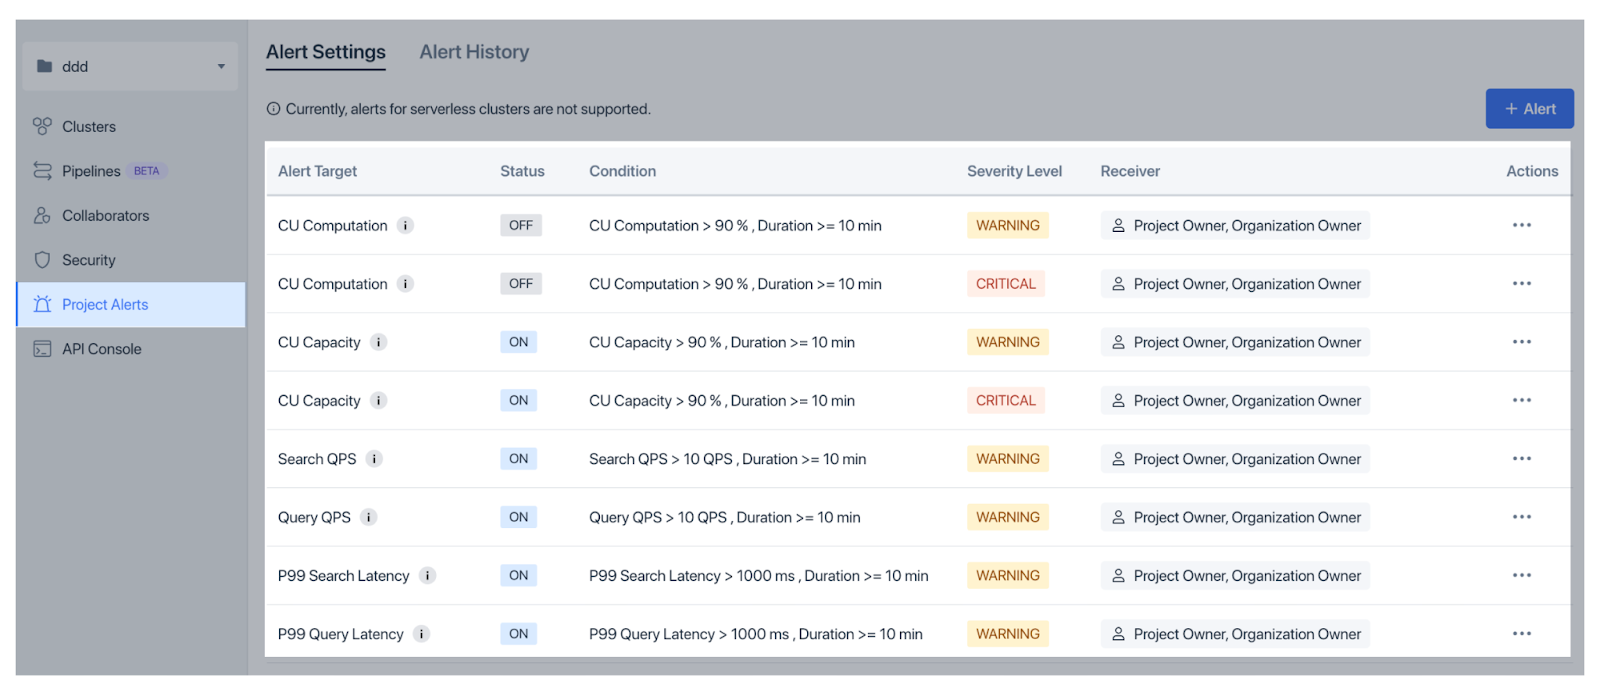 Figure: Project alerts in Zilliz Cloud
Figure: Project alerts in Zilliz Cloud
Key Features
Real-time Monitoring for instant feedback on cluster performance.
Customizable Dashboards tailored to your key metrics.
Flexible Alerts for early detection of potential issues.
Multiple Notification Channels (email, Slack, PagerDuty).
Historical Data to analyze performance trends for long-term planning.
Conclusion
Observability is an approach to understanding and maintaining the health of modern, complex systems. Using metrics, logs, and traces, teams can ensure reliable performance, quickly resolve issues and enhance user experiences. As systems grow and evolve, adopting best practices for observability is important for staying ahead of problems and scaling efficiently. Whether running distributed microservices or building AI-driven applications with tools like Milvus, observability provides the visibility needed to keep everything running smoothly and reliably.
FAQs on Observability
What is observability, and why is it important? Observability is the practice of understanding a system's internal state by collecting and analyzing data like metrics, logs, and traces. It’s important for diagnosing issues, monitoring performance, and maintaining system reliability, especially in complex modern setups like microservices and cloud-native applications.
How does observability differ from monitoring? While monitoring tracks specific metrics to detect issues, observability goes deeper by providing insights into the "why" behind those issues. Monitoring is like a checklist, while observability is like a full investigation into the system's behavior and state.
What are the core components of observability? The three pillars of observability are metrics (numerical data on system performance), logs (detailed event records), and traces (paths taken by requests across services). These combined offer a comprehensive view of a system's health and performance.
Why is observability essential for distributed systems? Distributed systems, like those built on microservices or cloud platforms, have multiple interacting components. Observability helps monitor and debug issues across these components, making it easier to track performance problems, identify bottlenecks, and maintain system health.
Additional Resources
- What is Observability?
- Why Observability Matters?
- Core Pillars of Observability
- How Observability Works?
- Use Cases of Observability
- Tools and Technologies for Observability
- Observability Challenges
- Observability Best Practices
- Observability vs. Monitoring
- Observability in Milvus and Zilliz Cloud: Track Vector Database Performance
- Conclusion
- FAQs on Observability
- Additional Resources
Content
Start Free, Scale Easily
Try the fully-managed vector database built for your GenAI applications.
Try Zilliz Cloud for Free