Introducing Comprehensive Monitoring & Observability in Zilliz Cloud
At Zilliz, we're committed to providing our users with the tools they need to build and maintain high-performance vector database applications. In the past few months, our engineering teams have been working on a wide range of monitoring and observability features, and we're excited to share them with you today. This powerful addition to our platform enables users to monitor their clusters' performance, set up custom alerts, and quickly respond to potential issues.
Cluster Metrics: Visibility into Your Vector Database Performance
Our new Metrics dashboard provides a comprehensive view of your cluster's performance across several key areas:
5 Resources Metrics: Monitor CPU usage, memory utilization, and storage consumption.
9 Performance Metrics: Track queries per second (QPS), vectors per second (VPS), and latency for both read and write operations.
4 Data Metrics: Monitor your collection count, entity count, and loaded entities.
These metrics are available through an intuitive dashboard, allowing you to select custom time ranges for granular analysis.
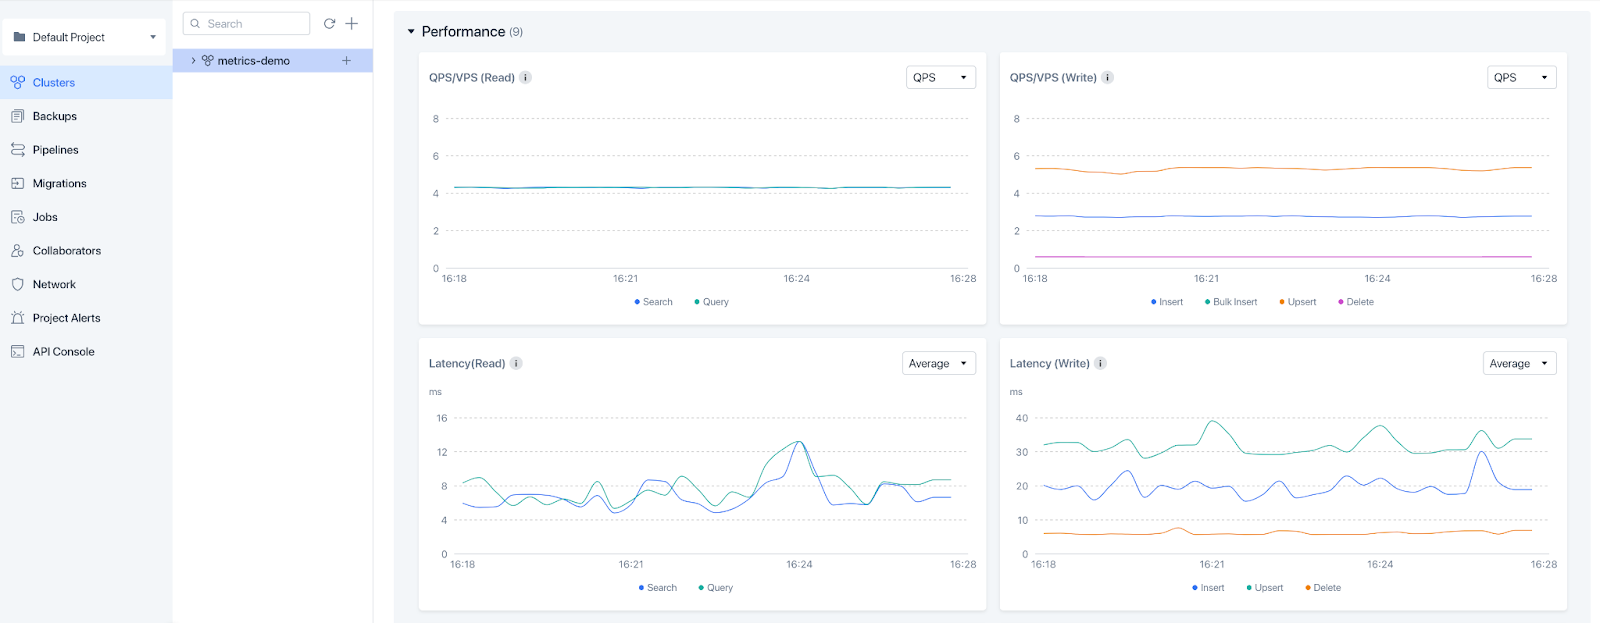 cluster metrics screenshot.png
Figure 1: Screenshots of Zilliz Cloud Monitoring Metrics
Customizable Alerts: Stay Ahead of Potential Issues
To complement our metrics, we've introduced two types of alerts:
- 5 Organization Alerts: Focus on billing-related matters such as credit card expiration, free credit balance, and usage costs.
 Figure 2- Screenshot of Organization Alerts .png
Figure 2: Screenshot of Organization Alerts
- 34 Project Alerts: Monitor operational aspects of your clusters, including CU usage, QPS thresholds, latency issues, and request anomalies.
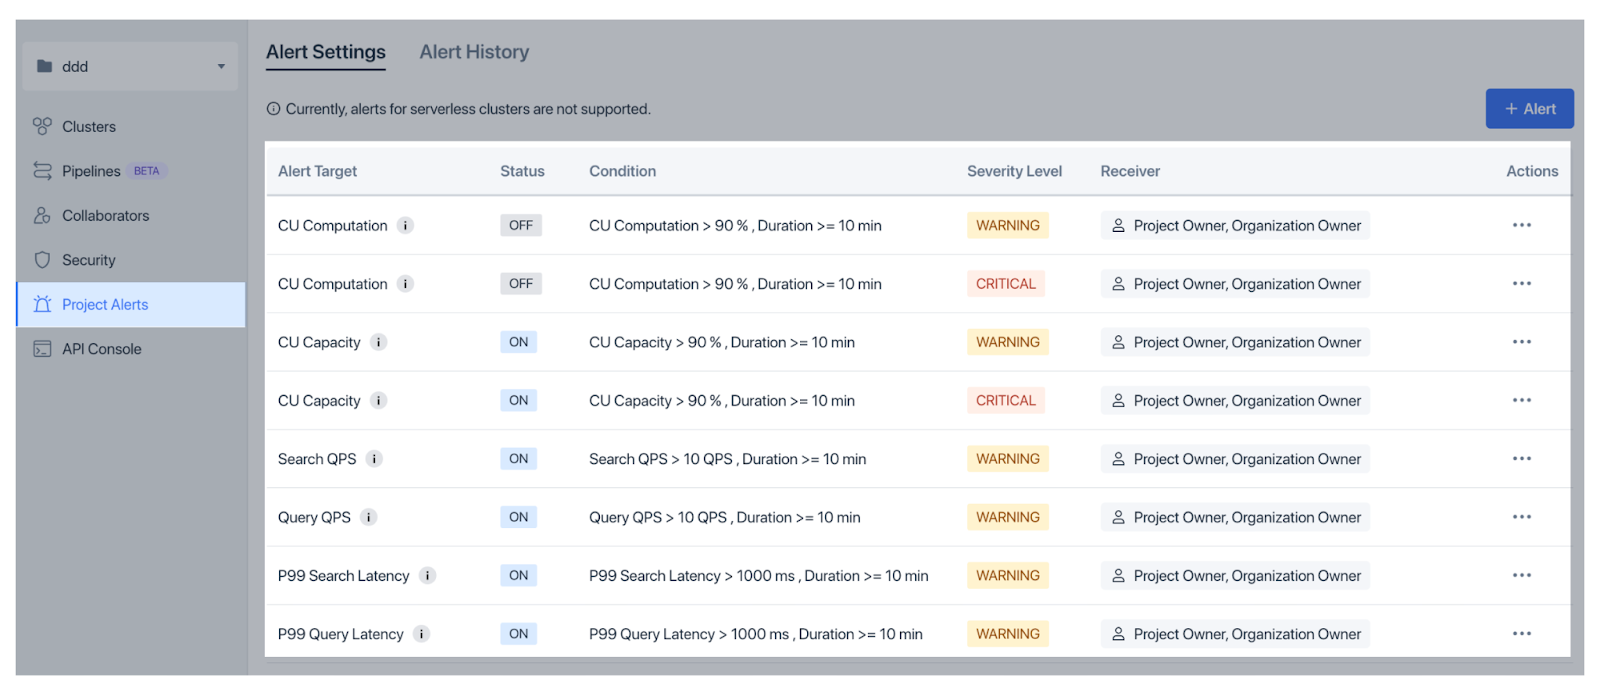 Figure 3- Screenshot of Project Alerts.png
Figure 3: Screenshot of Project Alerts
Our alert system comes with predefined targets and conditions, but also allows for extensive customization. You can set thresholds, durations, and choose from various severity levels to tailor the alerts to your specific needs.
Key Features of Our Metrics and Alerts System
Our new Monitoring & Observability system is designed to give you comprehensive insights into your Zilliz Cloud clusters. Here's what you can expect:
Real-time Monitoring enables you to get up-to-the-minute insights into your cluster's performance. This immediate feedback allows you to quickly identify and respond to any performance issues as they arise.
We've implemented Customizable Dashboards that allow you to tailor your view to focus on the metrics that matter most to your use case. Whether you're primarily concerned with query performance, resource utilization, or data growth, you can configure your dashboard to highlight these key areas.
Our Flexible Alert Configuration system lets you set up alerts with custom thresholds and durations. This granular control helps you catch potential issues early, allowing for proactive management of your clusters.
To ensure you never miss an important notification, we've integrated Multiple Notification Channels. You can receive alerts via email, PagerDuty, slack or webhook integrations, making it easy to incorporate these notifications into your existing workflow and monitoring systems.
Lastly, our system provides access to Historical Data, allowing you to analyze performance trends over time. This feature is crucial for long-term optimization, capacity planning, and understanding the impact of changes to your system.
These features work together to provide a robust monitoring and observability solution, empowering you to maintain the optimal performance of your Zilliz Cloud clusters.
Getting Started
Our Monitoring & Observability features are designed to be easily accessible within your Zilliz Cloud console. Here's how you can start leveraging these tools:
Accessing Metrics: Navigate to the Metrics tab within your cluster view to explore detailed performance data.
Setting Up Alerts: Visit the Organization Alerts or Project Alerts pages to configure and manage your alert settings.
For in-depth information about our Monitoring & Observability features, including step-by-step guides and best practices, visit our documentation page. These resources will help you make the most of these powerful tools and optimize your Zilliz Cloud experience.
What's Next?
We're committed to continually enhancing our metrics and alerts system. Here's a glimpse into our roadmap:
Alert Templates: We're developing templates for quick setup and easy application to multiple alerts, streamlining the alert configuration process.
Pod Resource Metrics: Upcoming metrics will include detailed pod-level information, such as CPU usage, Memory usage, and Network flow.
Enhanced Data Operations Metrics: We're expanding our metrics to provide deeper insights into your data operations, including Indexed entity metrics, Cluster connection metrics, and more.
Third-Party Integrations: To support advanced monitoring setups, we're developing integrations with popular monitoring platforms Datadog and Prometheus.
These upcoming features will provide even more granular control and insight into your Zilliz Cloud clusters, enabling you to optimize performance and respond to issues more effectively. To learn more about Zilliz Cloud's new Metrics and Alerts feature, join our release deep-dive webinar on October 3rd.
We're excited to introduce these enhancements in the coming months. Your feedback is crucial in shaping Zilliz Cloud. Share your thoughts through Discord or contact our support team.
We look forward to hearing from you as you explore these new Monitoring & Observability features.
Keep Reading
Introducing Functions and Model Inference on Zilliz Cloud: Automatic Embedding and Reranking with Hosted Models
Zilliz Cloud Functions auto-generate embeddings via OpenAI, Voyage AI, Cohere, or Zilliz Hosted Models. Built-in reranking — just insert text and search.
Why AI Databases Don't Need SQL
Whether you like it or not, here's the truth: SQL is destined for decline in the era of AI.
Why Deepseek is Waking up AI Giants Like OpenAI And Why You Should Care
Discover how DeepSeek R1's open-source AI model with superior reasoning capabilities and lower costs is disrupting the AI landscape and challenging tech giants like OpenAI.
