Monitoring Milvus with Grafana and Loki
Introduction to monitoring Milvus with Grafana & Loki
This post will guide you through setting up Grafana and Loki to monitor your Milvus deployments effectively.
Milvus is a distributed vector database that aims to store, index, and manage massive embedding vectors. Its ability to efficiently index and search through trillions of vectors makes Milvus a go-to choice for AI and machine learning workloads.
On the other hand, Grafana is an open-source platform for monitoring and observability, ideal for visualizing metrics, logs, and traces. It allows you to create dashboards to keep tabs on system health and performance. Loki pairs with Grafana as a log aggregation system, taking inspiration from Prometheus. It manages logs efficiently and cost-effectively. Together, Grafana and Loki offer a solid monitoring setup, boosting observability for Milvus and beyond.
Prerequisites
Docker - Ensure Docker is installed on your system.
Kubernetes - Have a Kubernetes cluster ready. You can use
minikube or k3dfor local development or a cloud provider's Kubernetes service for production environments.Helm - Install Helm, a package manager for Kubernetes, to help you manage Kubernetes applications, you can check our documentation to see how to do that https://milvus.io/docs/install_cluster-helm.md
Kubectl - Install
kubectl, a command-line tool for interacting with Kubernetes clusters, to deploy applications, inspect and manage cluster resources, and view logs.
Setting Up K8s
After installing everything needed to run a K8s cluster, and if you used minikube, start your cluster with:
minikube start
Check the status of your K8s cluster with:
kubectl cluster-info
⚠️You will also need to deploy Milvus on K8s, have a look at our Getting Started guide on how you can do that.
Deploying Grafana
Grafana is the analytics and interactive visualization platform we will use. It provides a rich variety of charts, graphs, and alerts. It allows you to query, visualize, create alerts on your metrics regardless where they are stored.
The installation will be done with Helm
helm repo add grafana https://grafana.github.io/helm-charts
helm repo update

helm install grafana grafana/grafana --namespace grafana --create-namespace
You can check that everything is running correctly by running
 ❯ kubectl get all -n grafana
NAME                          READY   STATUS    RESTARTS      AGE
pod/grafana-987d4c5c6-sb8t9   1/1     Running   1 (58m ago)   47h

NAME              TYPE        CLUSTER-IP      EXTERNAL-IP   PORT(S)   AGE
service/grafana   ClusterIP   10.43.114.168   <none>        80/TCP    47h

NAME                      READY   UP-TO-DATE   AVAILABLE   AGE
deployment.apps/grafana   1/1     1            1           47h

NAME                                DESIRED   CURRENT   READY   AGE
replicaset.apps/grafana-987d4c5c6   1         1         1       47h
Deploying Loki & Promtail
Loki is a log aggregation system inspired by Prometheus. It manages logs efficiently and cost-effectively. Loki uses Promtail to aggregate logs. Promtail is a log collector agent that collects, labels, and ships logs to Loki. It is explicitly made for Loki. You will see that an instance of Promtail runs on each Kubernetes node.
Loki's approach to log indexing is unique. It doesn't index the actual text of the logs. Instead, log entries are intelligently grouped into streams and then indexed with labels. This method significantly reduces costs and the time between log ingestion and their availability in queries, providing a sense of relief in resource management.
Loki can be deployed in different ways:
Monolithic mode: This mode is straightforward, all components of Loki run within a single process. It's suitable for smaller setups or for getting acquainted with Loki without much complexity.
Scalable mode: In this mode, Loki's components are split into separate services, such as distributors, ingesters, queriers, and others.
This setup is designed for high availability and scalability, fitting well with large-scale deployments. It requires an S3-compatible object storage to store the log data, which could be AWS S3, Google Cloud Storage, or a self-hosted solution like MinIO.
To install Loki:
helm upgrade --install loki grafana/loki-distributed -n grafana-loki --create-namespace
This will install loki within the grafana-loki namespace. If the namespace doesn't exist, Helm will create it for you.
Make sure that everything works correctly again by running the following:
❯ kubectl get all -n grafana-loki
NAME                                                        READY   STATUS    RESTARTS      AGE
pod/loki-loki-distributed-distributor-6b75796c6b-qvdbc      1/1     Running   1 (68m ago)   28h
pod/loki-loki-distributed-querier-0                         1/1     Running   1 (68m ago)   28h
pod/loki-loki-distributed-query-frontend-55574bdd64-5hhvl   1/1     Running   1 (68m ago)   28h
pod/loki-loki-distributed-ingester-0                        1/1     Running   1 (68m ago)   28h
pod/loki-loki-distributed-gateway-c6ccc655b-mkg5j           1/1     Running   0             67m

NAME                                                    TYPE        CLUSTER-IP     EXTERNAL-IP   PORT(S)                      AGE
service/loki-loki-distributed-memberlist                ClusterIP   None           <none>        7946/TCP                     47h
service/loki-loki-distributed-ingester-headless         ClusterIP   None           <none>        3100/TCP,9095/TCP            47h
service/loki-loki-distributed-query-frontend-headless   ClusterIP   None           <none>        3100/TCP,9095/TCP,9096/TCP   47h
service/loki-loki-distributed-ingester                  ClusterIP   10.43.13.160   <none>        3100/TCP,9095/TCP            47h
service/loki-loki-distributed-querier-headless          ClusterIP   None           <none>        3100/TCP,9095/TCP            47h
service/loki-loki-distributed-distributor               ClusterIP   10.43.201.9    <none>        3100/TCP,9095/TCP            47h
service/loki-loki-distributed-query-frontend            ClusterIP   10.43.99.40    <none>        3100/TCP,9095/TCP,9096/TCP   47h
service/loki-loki-distributed-gateway                   ClusterIP   10.43.186.50   <none>        80/TCP                       47h
service/loki-loki-distributed-querier                   ClusterIP   10.43.53.211   <none>        3100/TCP,9095/TCP            47h

NAME                                                   READY   UP-TO-DATE   AVAILABLE   AGE
deployment.apps/loki-loki-distributed-distributor      1/1     1            1           47h
deployment.apps/loki-loki-distributed-query-frontend   1/1     1            1           47h
deployment.apps/loki-loki-distributed-gateway          1/1     1            1           47h

NAME                                                              DESIRED   CURRENT   READY   AGE
replicaset.apps/loki-loki-distributed-distributor-6b75796c6b      1         1         1       47h
replicaset.apps/loki-loki-distributed-query-frontend-55574bdd64   1         1         1       47h
replicaset.apps/loki-loki-distributed-gateway-c6ccc655b           1         1         1       47h

NAME                                              READY   AGE
statefulset.apps/loki-loki-distributed-querier    1/1     47h
statefulset.apps/loki-loki-distributed-ingester   1/1     47h
To install Promtail:
Before installing Promtail, you'll need to configure it to communicate with Loki. This involves editing a configuration file to specify Loki's service URL:
- Extract the default Promtail configuration:
helm show values grafana/promtail > promtail-overrides.yaml
This command writes the default Promtail values to a file named promtail-overrides.yaml, which you can then modify.
- Edit the default Promtail configuration:
Edit promtail-overrides.yaml to set the clients.url value to Loki's service endpoint. In Kubernetes, services are accessible via DNS records, so you can use the DNS name of Loki's service: loki-loki-distributed-gateway.grafana-loki.svc.cluster.local

N.B.: If you deployed Loki in a different namespace or under a different name, adjust the URL accordingly, feel free to check out the Kubernetes documentation.
- Deploy Promtail with your modified configuration file:
helm upgrade --install --values promtail-overrides.yaml promtail grafana/promtail -n grafana-loki
This command tells Helm to deploy Promtail in the grafana-loki namespace, using your custom configuration. It ensures Promtail is set up to forward logs to Loki, completing your log aggregation setup.
As usual, makes sure that everything works by running:
❯ kubectl get all -n grafana-loki | grep promtail                                                                                    pod/promtail-qgl4t                                          1/1     Running   1 (77m ago)   28h
daemonset.apps/promtail   1         1         1       1            1           <none>          2d
Configure Grafana Data Sources & Dashboard
With Loki and Promtail now deployed, the next step is integrating Loki as a data source within Grafana, enabling you to visualize and query your logs.
- Accessing Grafana: First, you need to access your Grafana instance. If Grafana is running within your Kubernetes cluster, you can use port forwarding to access the Grafana UI from your local machine:
kubectl port-forward service/grafana 8080:80 -n grafana
- Logging into Grafana: The default username for Grafana is admin. For the password, Grafana generates a random one when installed via Helm. You can retrieve it with:
kubectl get secret --namespace grafana grafana -o jsonpath="{.data.admin-password}" | base64 --decode ; echo

Navigating to Data Sources: Once logged in, go to the Grafana sidebar, find the icon for "Connections", and select "Data Sources".
Adding Loki: Click the "Add data source" button, search for Loki, and select it. You'll be taken to the Loki data source settings page.

- Configuring Loki in Grafana: Enter the URL for the Loki service, which will be something like
http://loki-loki-distributed-gateway.grafana-loki.svc.cluster.local, assuming the default setup. This URL points Grafana to your Loki instance within your Kubernetes cluster.

Explore your logs
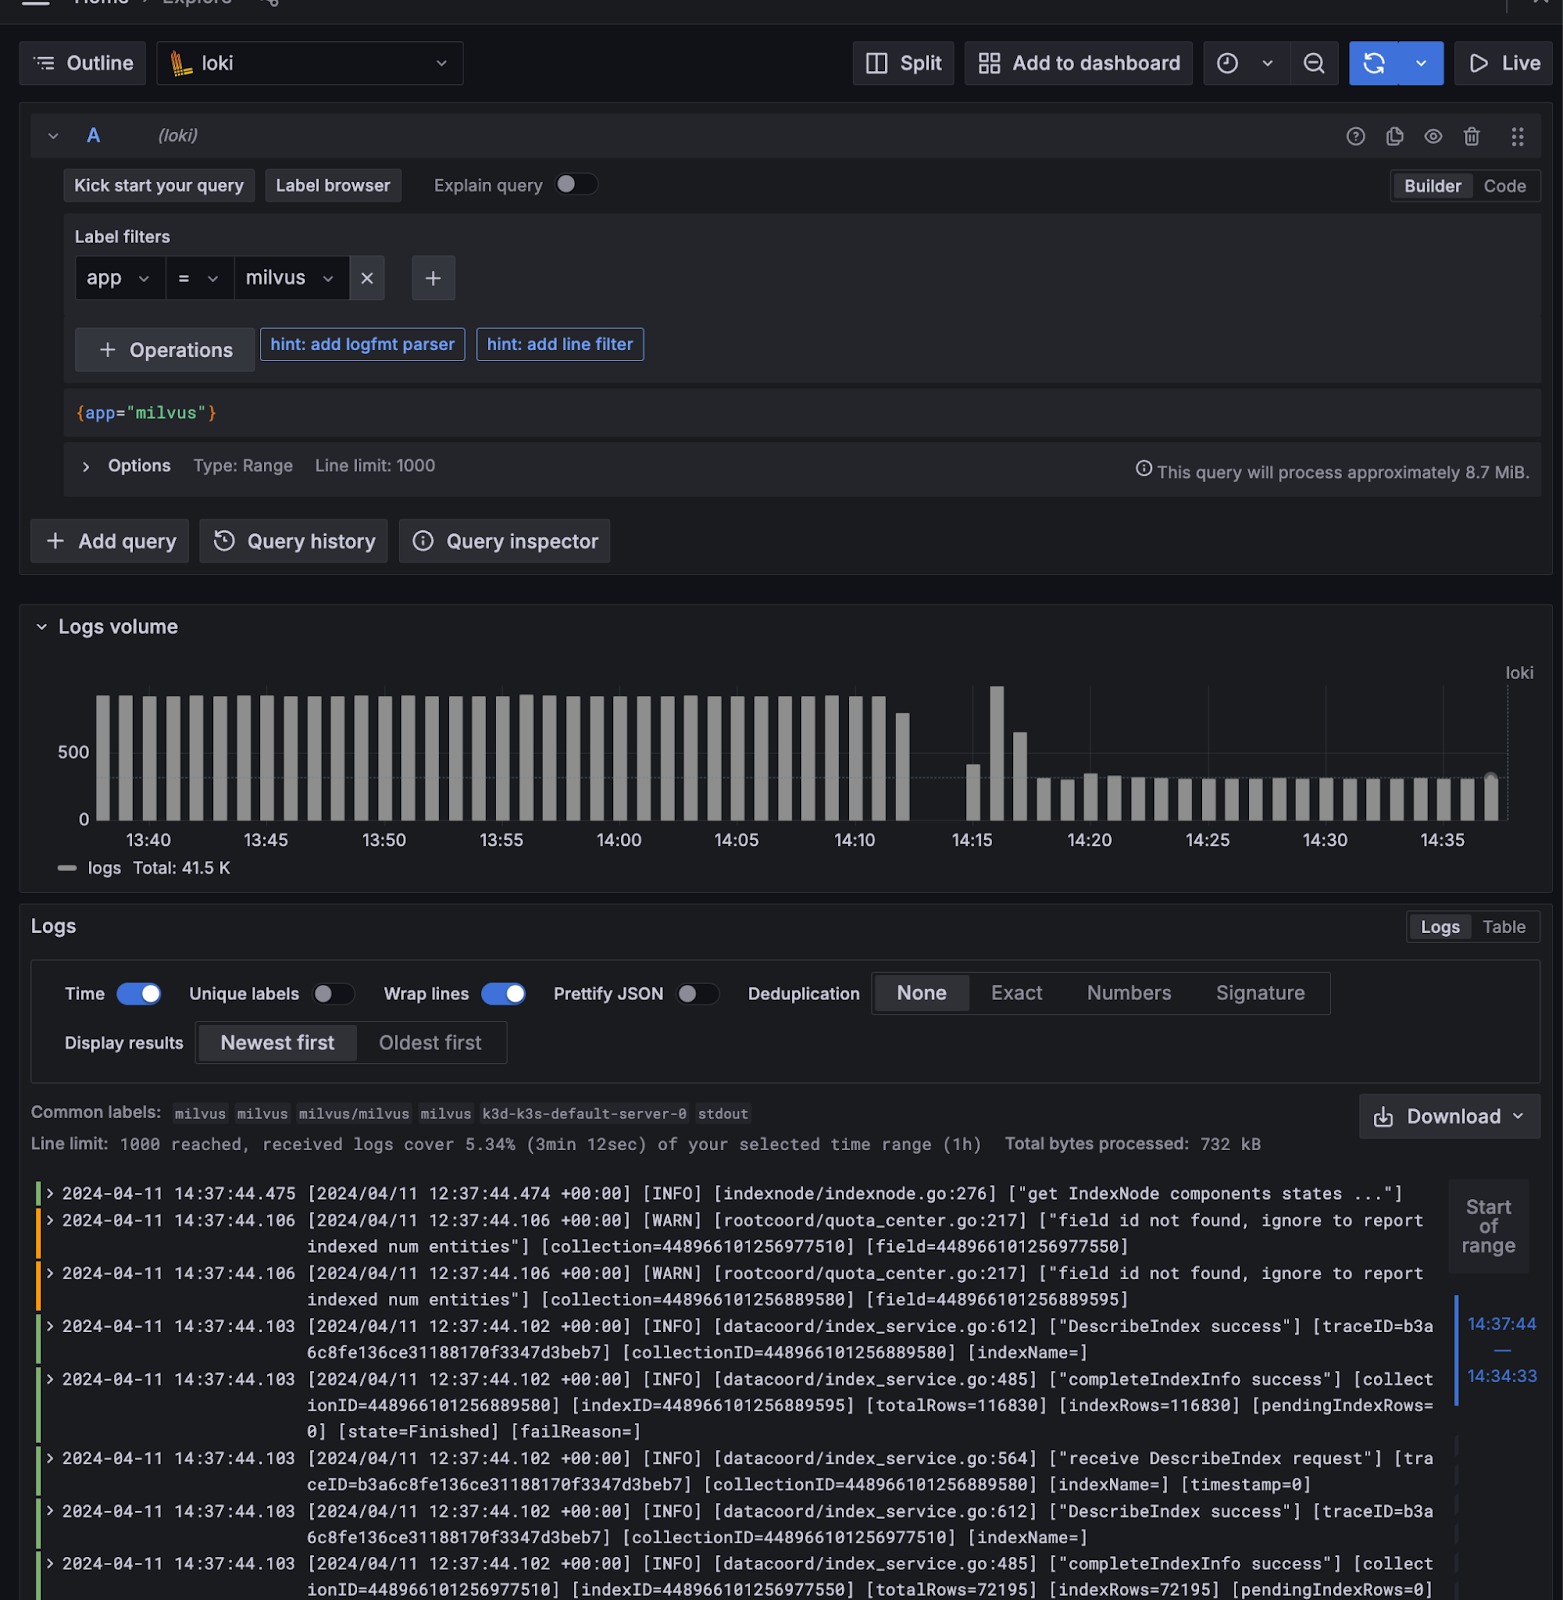
You can now explore your logs and make sure that everything is working properly and you can see Milvus’ logs. Filter out by app name and use milvus.

If you see some logs like on the screenshot above, congratulations, you can now monitor and offer insights into your Milvus cluster's operations thanks to Grafana and Loki! 🚀
Feel free to check out Milvus, the documentation on Visualizing Milvus Metrics in Grafana, and share your experiences with the community by joining our Discord.
Keep Reading

Why Not All VectorDBs Are Agent-Ready
Explore why choosing the right vector database is critical for scaling AI agents, and why traditional solutions fall short in production.

Zilliz Cloud Introduces Advanced BYOC-I Solution for Ultimate Enterprise Data Sovereignty
Explore Zilliz Cloud BYOC-I, the solution that balances AI innovation with data control, enabling secure deployments in finance, healthcare, and education sectors.

The Great AI Agent Protocol Race: Function Calling vs. MCP vs. A2A
Compare Function Calling, MCP, and A2A protocols for AI agents. Learn which standard best fits your development needs and future-proof your applications.
