Dimensionality Reduction: Simplifying Complex Data for Easy Analysis

TL;DR: Dimensionality reduction is a process used in data science and machine learning to reduce the number of variables, or "dimensions," in a dataset while retaining as much relevant information as possible. This reduction simplifies data analysis, visualization, and processing, especially in high-dimensional datasets. Techniques like Principal Component Analysis (PCA) and t-Distributed Stochastic Neighbor Embedding (t-SNE) identify patterns and relationships within data, projecting it onto fewer dimensions. By discarding less significant features, dimensionality reduction helps improve computational efficiency and mitigates overfitting, making it essential for managing complex data, particularly in fields like image and text analysis.
Dimensionality Reduction: Simplifying Complex Data for Easy Analysis
Dimensionality reduction simplifies a dataset by reducing the number of input variables or features while keeping important information. It plays a vital role in data science and machine learning. It makes working with large datasets more manageable, improves model performance, and saves valuable computational resources.
Imagine having a large, complex spreadsheet filled with many columns of data. If some of those columns are not helpful or need to be clarified for the analysis, dimensionality reduction trims them for easier pattern recognition.
The Curse of Dimensionality
The curse of dimensionality refers to the problems that arise when analyzing and organizing data in high-dimensional spaces. As the number of features (or dimensions) increases, the volume of the space expands so rapidly that the available data becomes sparse. This sparsity makes it difficult for algorithms to find meaningful patterns, making the data analysis inefficient and unreliable.
To understand the impact, imagine you are trying to measure the distance between points in a one-dimensional space, like a straight line. The points are close enough to be easily measured. If you expand this to two dimensions, like a flat piece of paper, the points spread further. When you increase to three dimensions, like a room, they become even more spread out. As dimensions keep increasing, the points get so far apart that they seem almost isolated, and calculating the distance becomes less useful. This happens in high-dimensional data, where common data analysis techniques may fail to work effectively because relationships between data points become diluted, as shown in the figure.
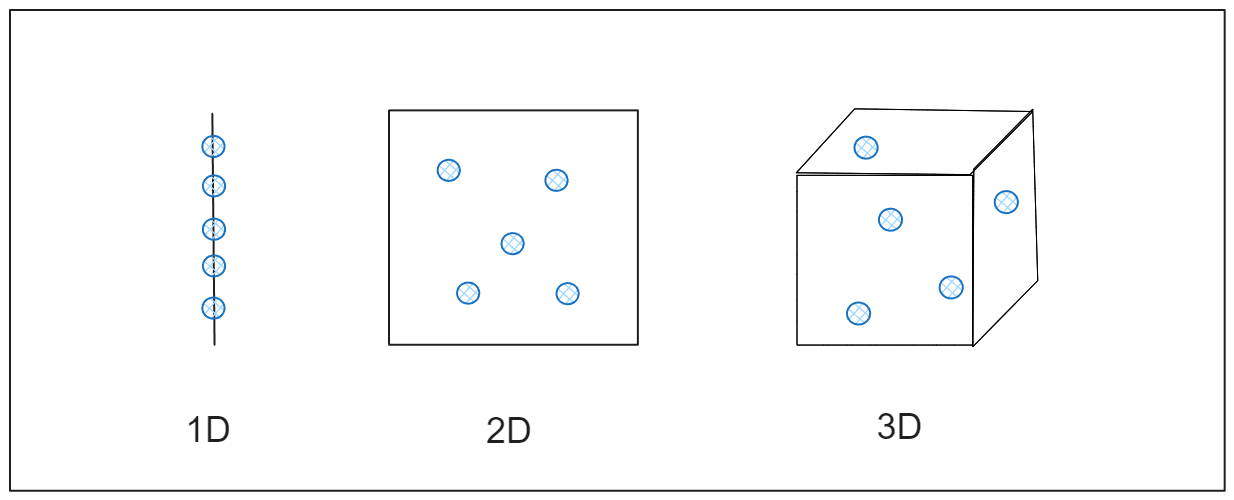 Figure- How Data Expands Across Dimensions.png
Figure: How Data Expands Across Dimensions
A simple analogy is finding friends in a park. You can locate each other quickly if you and your friends are spread out across a small park. But imagine the park growing to the size of a massive city. Now, even with the same number of friends, finding one becomes challenging because everyone is too far apart. Similarly, in high-dimensional spaces, data points become scattered, making it hard for algorithms to organize or analyze them efficiently.
Key Dimensionality Reduction Techniques
Although there are different strategies for dimensionality reduction, it can be broadly categorized into two main types: Feature Selection and Feature Extraction. Both methods aim to simplify data, but in different ways.
Feature Selection
Feature selection reduces dimensionality by selecting a subset of the most relevant features from the original dataset. Instead of transforming the data, this approach keeps the features as they are but drops those that do not contribute significantly to the analysis or model performance. The goal is to remove redundant or irrelevant features to make the dataset simpler and easier to work with.
There are three common methods used for feature selection:
Filter Methods: These use statistical tests to rank features based on their importance. Examples include correlation scores, information gain, and chi-square tests. They are straightforward and work independently of the machine learning model.
Wrapper Methods: These evaluate different subsets of features and use model performance to determine the best combination. Although more accurate, they can be computationally expensive. Techniques like recursive feature elimination (RFE), forward selection, and backward elimination fall under this category.
Embedded Methods: These techniques integrate feature selection into the model training process. Models like decision trees, Lasso regression, and ridge regression automatically identify important features as part of their training.
Feature Extraction
Feature extraction transforms the original features into a lower-dimensional space, creating new features that still capture the essential information. This approach is useful when you compress data while retaining meaningful relationships between features. Unlike feature selection, feature extraction creates entirely new representations of the data.
The most widely adapted techniques are Principal Component Analysis (PCA), t-distributed Stochastic Neighbor Embedding (t-SNE), and Linear Discriminant Analysis (LDA). Let’s discuss them in detail.
Principal Component Analysis (PCA)
Principal Component Analysis (PCA) is a popular technique used for dimensionality reduction. Its main purpose is to simplify a large set of variables into a smaller set that still captures most of the information in the original data.
To understand PCA simply, think of a dataset as a multi-dimensional object, like a cloud of points in space. PCA finds the directions (or axes) where the data varies the most and projects the data onto these new axes. The first axis, called the principal component, captures the most variance (or spread) in the data. The second axis captures the next most variance, and so on. By focusing on just the first few components, PCA reduces the number of dimensions while still keeping the main structure of the data intact.
The following diagrams show how PCA works to simplify data. On the left, there is a scatter plot of points spread out in two directions. PCA finds the main direction where the data varies the most, shown by the black arrow. The right side shows the data being flattened along this direction.
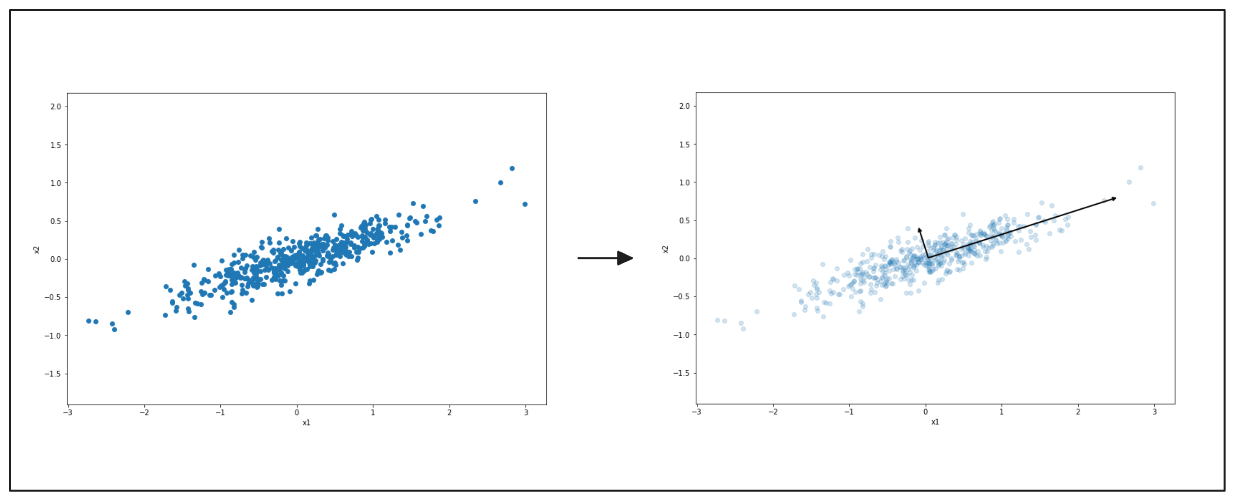 Figure- PCA highlighting the main direction of data variation..png
Figure: PCA highlighting the main direction of data variation.
Again, on the left, you see data spread in two dimensions. The black arrow points to the main direction of variation. On the right, the data is compressed onto this line, reducing it to a simpler form. This process makes the data easier to work with but still keeps the main patterns.
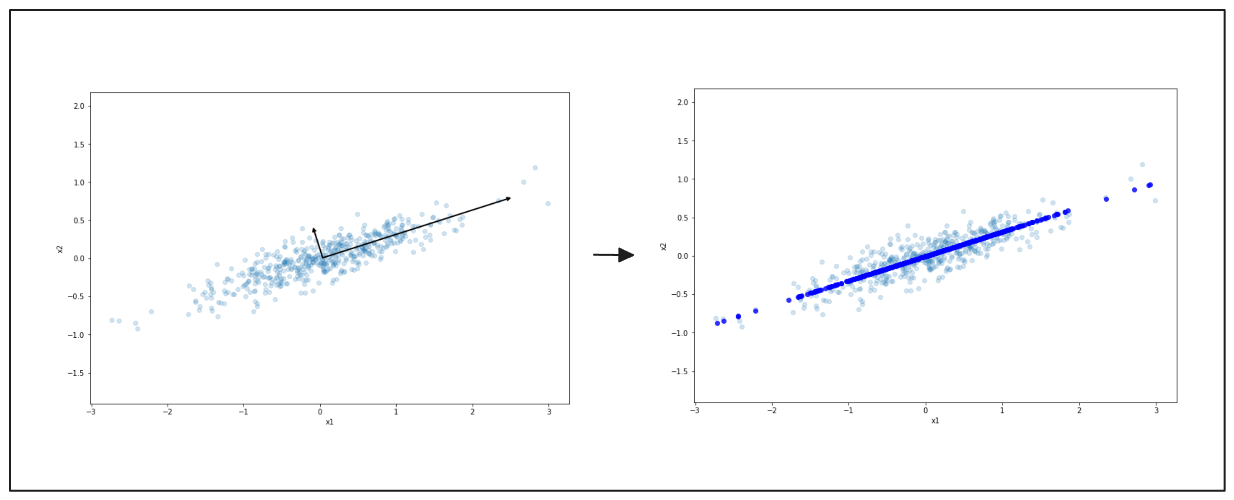 Figure- Simplified Data Representation with PCA.png
Figure: Simplified Data Representation with PCA
Pros of Using PCA
Reduces Complexity: Simplifying datasets with many variables makes analysis faster and more efficient.
Removes Noise: PCA filters out noise and irrelevant information by keeping the components with the most variance.
Improves Visualization: PCA helps visualize high-dimensional data in two or three dimensions, revealing patterns that might otherwise be hidden.
Cons of Using PCA
Loss of Information: Some data may be lost during the dimensionality reduction, affecting model performance.
Harder Interpretability: The new features created by PCA are combinations of the original features, which make them difficult to interpret in a meaningful way.
Assumes Linearity: PCA works best when the relationships between variables are linear, which may not always be true.
Practical Applications
Image Compression: Reduces image file size while retaining key visual features.
Finance: Simplifies complex datasets to identify patterns in stock price movements.
Genetics: Analyzes large genomic datasets to uncover meaningful data structures.
Versatility: Useful for simplifying and interpreting high-dimensional data across various fields.
t-Distributed Stochastic Neighbor Embedding (t-SNE)
t-Distributed Stochastic Neighbor Embedding (t-SNE) visualizes high-dimensional data. It projects data into two or three dimensions to identify clusters and patterns. t-SNE is widely valued for its ability to maintain the local relationships between data points, which helps reveal the dataset's underlying structure. This method is more suited for datasets in 3D space.
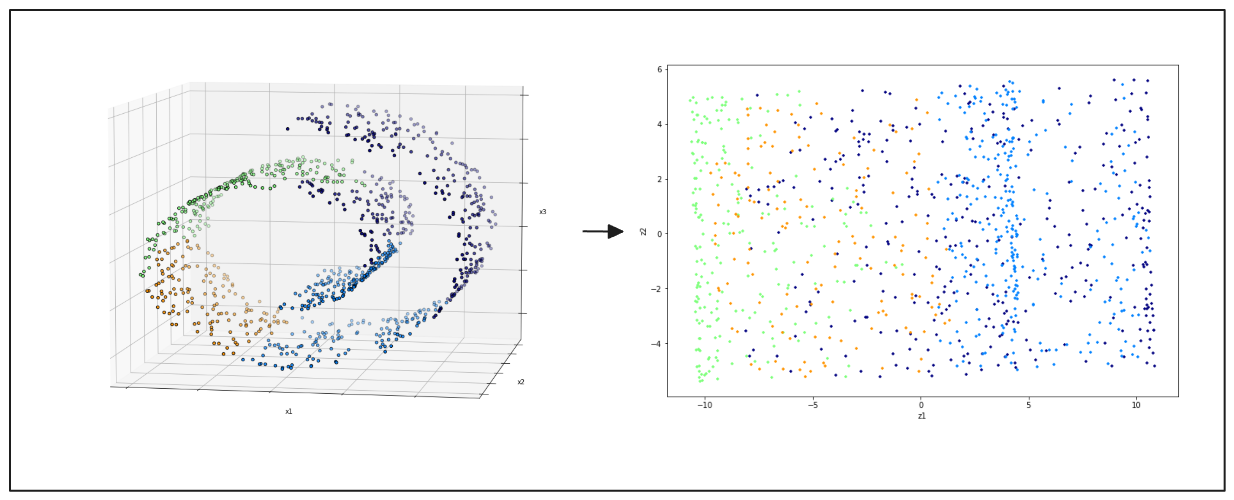 Figure- left- swiss roll 3D data points, right- 2D projection result from PCA.png
Figure: left: swiss roll 3D data points, right: 2D projection result from PCA
Pros of Using t-SNE
Preserve Local Structure: t-SNE excels at keeping nearby data points close in the lower-dimensional space, making it effective for visualizing clusters.
Useful for Complex Data: It is particularly good at handling nonlinear relationships and exploring intricate patterns in data.
Great for Visualization: t-SNE produces visually intuitive and appealing scatter plots that help understand the data layout.
Cons of Using t-SNE
Computationally Intensive: Running t-SNE can be slow and resource-heavy, especially for large datasets.
Requires Parameter Tuning: Parameters like perplexity and learning rate must be carefully set, and the results can vary significantly based on these settings.
Distorts Global Structure: While t-SNE preserves local relationships well, it may distort the data's global structure and make it less useful for understanding large-scale relationships.
Practical Applications
High-Dimensional Data Visualization: Useful for exploring cluster structures.
Image Recognition: Visualizes the distribution of image features.
Natural Language Processing (NLP): Explores word embeddings.
Genomics: Identifies meaningful genetic data clusters.
Popularity: Widely used by data scientists for visual insights despite limitations.
Linear Discriminant Analysis (LDA)
Unlike PCA, LDA aims to maximize the separation between different classes in the data. It does so by projecting the data onto a lower-dimensional space that best separates the categories based on their labels.
LDA is commonly used in scenarios where data classification is the primary goal. It’s especially useful when dealing with datasets that have clear class boundaries. Some practical applications include face recognition, medical diagnosis, and text classification.
How LDA differ from PCA?
Objective: LDA focuses on maximizing class separability, while PCA aims to capture the most variance in the data without considering class labels.
Supervised vs. Unsupervised: LDA is a supervised technique that uses class labels in its computations. PCA, on the other hand, is unsupervised and does not use any label information.
Data Variance: LDA reduces dimensions by finding the axes that maximize the distance between the means of different classes while minimizing the spread within each class. PCA does not consider class information and its only goal is to reduce redundancy in the data.
Other Techniques and Emerging Methods
In addition to traditional dimensionality reduction techniques like PCA, t-SNE, and LDA, several other methods and emerging trends are gaining traction in data analysis.
Autoencoders
Autoencoders are neural networks used for unsupervised learning that aim to compress data into a lower-dimensional representation and then reconstruct it back to its original form. The network consists of an encoder that reduces dimensionality and a decoder that reconstructs the input from the compressed representation. Autoencoders are useful for handling nonlinear relationships in data and can learn complex feature representations.
Independent Component Analysis (ICA)
Independent Component Analysis (ICA) is a computational technique for separating a multivariate signal into additive, independent components. Unlike PCA, which focuses on variance, ICA looks for statistically independent sources. This method is often used in applications like blind source separation, such as isolating different audio sources from a mixed recording.
Uniform Manifold Approximation and Projection (UMAP)
Uniform Manifold Approximation and Projection (UMAP) is a relatively new technique for dimensionality reduction that preserves both local and global structures in the data. It is based on manifold learning and aims to maintain the relationships between data points during the reduction process. UMAP is faster and often produces better visualizations compared to t-SNE.
Benefits of Dimensionality Reduction
Dimensionality reduction offers several key advantages that enhance the analysis of complex datasets:
Simplified Models: Fewer features lead to more straightforward models that are easier to train and analyze, which can be crucial for time-sensitive applications.
Reduces Storage and Computational Requirements: Handling lower-dimensional data results in less storage and faster processing times, which can lower operational costs, especially with large datasets.
Improves Model Performance: By considering the most significant features, models can become more accurate and robust, as they are less likely to be affected by irrelevant data.
Enhances Interpretability: Reducing dimensions can help highlight essential relationships in the data that help stakeholders understand model decisions and the underlying patterns.
Facilitates Data Visualization: Transforming high-dimensional data into two or three dimensions allows for clearer visual representations, aiding in discovering insights that may not be evident in higher dimensions.
Aids in Noise Reduction: By removing less important dimensions, dimensionality reduction can decrease the amount of noise, resulting in cleaner datasets that contribute to more reliable analyses.
Supports Improved Feature Engineering: The process can help identify the most impactful features, providing opportunities for creating enhanced features that can lead to better model performance.
Enables Faster Prototyping: With fewer dimensions to consider, data scientists can iterate on model development quickly for rapid testing and refinement of models.
Challenges in Dimensionality Reduction
Dimensionality reduction techniques come with several challenges that need careful consideration:
Risk of Losing Important Information: Reducing dimensions can inadvertently discard essential features, which may negatively affect model performance and lead to misinterpretation of results.
Choosing the Right Technique: The effectiveness of dimensionality reduction methods varies depending on the dataset's nature and the specific analytical goals. This variability makes it crucial to understand the strengths and limitations of each technique to avoid ineffective outcomes.
Computational Cost: Techniques such as t-SNE can be resource-intensive and less feasible for large datasets. The time and memory requirements can significantly limit their applicability in time-sensitive scenarios.
Balancing Reduction and Accuracy: Achieving the right level of dimensionality reduction while ensuring that the model retains sufficient information for accurate predictions is a constant challenge. Over-reduction can simplify the data too much, impacting the model's ability to capture necessary complexity.
Applications of Dimensionality Reduction in Various Industries
Dimensionality reduction techniques find applications across various fields, enhancing data analysis and improving model performance. Here are some practical scenarios where these methods are commonly used:
Image Processing: In fields like computer vision, dimensionality reduction helps compress image data while preserving essential features. For instance, in facial recognition, PCA can reduce thousands of pixel values to smaller features, speeding up processing without losing critical details. Similarly, in medical imaging, dimensionality reduction highlights important areas in MRI scans for quicker analysis.
Natural Language Processing: Dimensionality reduction is used to simplify high-dimensional text data, such as word embeddings. Methods like t-SNE help visualize word relationships and clusters, aiding sentiment analysis and topic modeling.
Genomics: In bioinformatics, dimensionality reduction techniques are essential for analyzing genetic data, where the number of variables (genes) can be extremely high. Reducing dimensions helps identify key genetic markers related to diseases.
Finance: Dimensionality reduction assists in risk management and portfolio optimization by simplifying large datasets of financial indicators. Analysts can choose the most relevant features that influence market behavior.
Recommendation Systems: In collaborative and content-based filtering, dimensionality reduction helps create more efficient recommendation algorithms by identifying underlying patterns in user preferences and item characteristics.
Healthcare: Analyzing patient data often involves high-dimensional datasets. Dimensionality reduction aids in identifying significant factors affecting patient outcomes, improving predictive modeling for disease progression.
Marketing Analytics: In marketing, understanding customer behavior is crucial. Dimensionality reduction allows businesses to segment customers easily by reducing the complexity of customer data, leading to targeted marketing strategies.
Manufacturing and Quality Control: In industrial applications, dimensionality reduction helps analyze machine sensor data to identify patterns and anomalies, leading to better quality control and predictive maintenance.
How Dimensionality Reduction Improves Vector Database Performance?
Dimensionality reduction significantly enhances the performance of vector databases like Milvus (created by Zilliz engineers), which is designed for managing large-scale unstructured data and its high-dimensional vector representations. Here’s how they are interconnected:
Efficient Data Storage: Milvus can store high-dimensional vector data generated by machine learning models. Applying dimensionality reduction techniques, such as PCA or t-SNE, helps compress these vectors, reducing the storage requirements and improving retrieval speeds.
Improved Query Performance: Searching through high-dimensional data can be computationally intensive in a vector database. Dimensionality reduction minimizes the dimensionality of the vectors, which accelerates similarity searches and nearest-neighbor queries.
Enhanced Data Visualization: When utilizing Zilliz or Milvus for data analysis, dimensionality reduction techniques can facilitate the visualization of complex datasets. This enables users to understand better data distributions, relationships, and patterns within the high-dimensional data stored in the database.
Facilitating Machine Learning Workflows: In machine learning pipelines, dimensionality reduction can help streamline data preprocessing. Reducing the input features' complexity enhances the training of machine learning models, leading to improved performance and interpretability.
Conclusion
Dimensionality reduction is an important technique in data science and machine learning that simplifies complex datasets while preserving essential information. Reducing the number of features enhances model performance, facilitates visualization, and aids in easy data analysis across various fields. Despite its challenges, such as the risk of losing important information and the need for careful technique selection, the benefits of dimensionality reduction make it invaluable for uncovering insights and improving the efficiency of analytical processes.
FAQs on Dimensionality Reduction
- What is dimensionality reduction?
Dimensionality reduction is a technique used to reduce the number of features or dimensions in a dataset while preserving as much relevant information as possible. This simplification makes analyzing, visualizing, and modeling complex data easier.
- Why is dimensionality reduction important in data science?
It helps improve model performance, reduces storage and computational requirements, enhances data visualization, and simplifies model interpretation, making it essential for efficient data analysis in various applications.
- What are some common techniques for dimensionality reduction?
Common techniques include Principal Component Analysis (PCA), t-distributed Stochastic Neighbor Embedding (t-SNE), Linear Discriminant Analysis (LDA), feature selection methods, and emerging techniques like autoencoders and UMAP.
- What are the challenges associated with dimensionality reduction?
Challenges include the risk of losing important information, the difficulty of choosing the right technique for specific datasets, the computational costs of certain methods, and balancing dimensionality reduction with model accuracy.
- How does dimensionality reduction benefit vector databases like Milvus?
Dimensionality reduction improves vector database performance by optimizing data storage, enhancing query performance, facilitating data visualization, and streamlining machine learning workflows.
Related Resources
- The Curse of Dimensionality
- Key Dimensionality Reduction Techniques
- Other Techniques and Emerging Methods
- Benefits of Dimensionality Reduction
- Challenges in Dimensionality Reduction
- Applications of Dimensionality Reduction in Various Industries
- How Dimensionality Reduction Improves Vector Database Performance?
- Conclusion
- FAQs on Dimensionality Reduction
- Related Resources
Content
Start Free, Scale Easily
Try the fully-managed vector database built for your GenAI applications.
Try Zilliz Cloud for Free