Understanding Continuous Profiling, Its Use Cases, Benefits, and Challenges

Understanding Continuous Profiling, Its Use Cases, Benefits, and Challenges
 continuous profiling.jpg
Why do some applications perform better than others? The answer often lies in monitoring techniques that constantly evaluate an application’s performance. As demand for enhanced user experience rises, the need for such monitoring systems increases. Organizations must establish robust frameworks to quickly address performance glitches and retain customers.
Companies can adopt continuous profiling to streamline their application workflows and fix problems as they emerge. The method lets engineers and developers perform real-time adjustments to ensure the application remains fast, reliable, and resource-efficient.
This post will explain continuous profiling, its benefits and challenges, and a few use cases and profiling tools. This information will help you implement an efficient continuous profiling pipeline to monitor application performance.
What is Continuous Profiling?
Continuous profiling is a monitoring method that collects and analyzes relevant metrics regarding a system’s or program’s operations. For instance, profiling can inform engineers about CPU usage, memory utilization, frequency and duration of function calls, and I/O activity.
This method gathers data from the production environment and uses automated pipelines to detect anomalies and inconsistencies in real time. It is a popular technique for managing data centers, where multiple servers are profiled 24/7 to analyze workload distribution, latency, and throughput.
With continuous profiling, system administrators and developers can quickly identify the root cause of a problem and store extensive profile data for later analysis.
How Does Continuous Profiling Work?
Profiling is an iterative process that should focus on events in the production environment to identify novel issues that may not arise in local offline setups.
Professionals use lightweight profilers that constantly collect real-time data on multiple metrics. Such profilers monitor applications with minimal impact on existing resources. They also help visualize the data on dashboards to identify trends, patterns, and inconsistencies.
There are two types of profilers: Sampling and instrumentation. The following sections explain how they help you understand their use cases.
Sampling Profiler
A sampling or statistical profiler collects performance data at different points in time to analyze the time spent on particular function calls. It works by periodically polling an application and monitoring code execution to determine potential bottlenecks.
The method consists of capturing resource usage data at fixed intervals called snapshots. The user aggregates these snapshots through statistical techniques to represent how the application uses system’s resources and executes function calls. Visualization tools can help summarize the information within these aggregations to help the user understand an application’s code path.
Since sampling profilers collect data at different periods, the process has minimal overhead and gives developers a holistic view of application performance. It also lets them identify long-term trends, such as memory leaks, by analyzing data over multiple time intervals.
Instrumentation Profiler
Instrumentation profiling performs more detailed monitoring and generates extensive feedback data to capture an application’s performance. The technique records function call duration, standard procedures, and event sequences.
The method requires modifying the source code to include the profiler at different checkpoints. Techniques to integrate the profiler include:
Code instrumentation
Runtime hooking
Sampling
The profiler collects data on relevant metrics at the specified checkpoints and allows developers to perform detailed analyses involving machine learning (ML) and statistical approaches.
Although instrumentation profiling provides informational depth, it can introduce significant runtime overhead during code execution. Additionally, code manipulation to instrument the profiler can cause errors and result in additional performance bugs.
Data Visualization
Data visualization is crucial in profiling processes, providing developers an intuitive view of performance metrics. Frame graphs are popular for viewing profiling data. They show stack traces to highlight the code paths and execution time.
 flame graph.png
They have color-coded horizontal bars representing the time spent in function calls, memory usage, CPU utilization, and other metrics. Each bar represents a step, such as a function, query, or API call within a code block.
The topmost bar, the parent span, represents the first execution request, and the bars below illustrate all the subsequent steps or child spans triggered along the code path. Each child bar can create another parent span if the code path enters another service or initiates a new call request.
The x-axis represents each span’s duration, which means wider spans imply the function call took a long time to complete. The y-axis shows a stack’s depth or the number of sub-requests resulting from a particular function call.
Profiling tools can generate these graphs and allow users to click on a specific bar to see execution time and errors. They can also view related metrics, logs, and telemetry statistics to better understand the execution workflow.
Traditional vs. Continuous Profiling
A concept related to continuous profiling is traditional profiling, which performs detailed real-time tracking of an application’s performance. It instruments each function call and event to provide detailed insights into an application’s code execution path.
Although traditional and continuous profiling helps monitor an application’s performance, they have a few critical differences. The following list summarizes these differences to help you distinguish between the two.
Use Case: Traditional profiling suits on-demand testing and offline environments. In contrast, continuous profiling offers constant monitoring to identify issues in time-sensitive applications quickly.
Scope: Developers can implement traditional profiling to test particular functions or modules, while continuous profiling can monitor an entire system.
Automation: Since developers perform traditional profiling on an ad hoc basis, it requires manual setup, whereas continuous profiling pipelines run automatically to record code execution data.
Benefits and Challenges of Continuous Profiling
Continuous profiling is an effective tool for determining the efficiency of your application and workload distribution. However, implementing continuous profiling is challenging as developers must balance data coverage and high overhead.
The following sections explain the benefits of continuous monitoring in more detail to help you understand the method’s strengths and weaknesses.
Benefits
Real-time Monitoring: Developers can get continuous real-time insights into how their application is performing in the production environment.
Minimal Overhead: Continuous profiling tools add minimal overhead to existing operations. Although instrumentation can cause performance issues, handling code manipulation tactfully can mitigate these problems.
Better Debugging: With extensive performance data for different periods and checkpoints, continuous profiling helps developers identify the root cause and debug issues more efficiently.
Optimization: As developers identify issues, they can quickly fix and enhance an application’s code base to optimize performance without causing downtime.
Data Analytics: Continuous profiling can generate rich performance data that developers can store and analyze using advanced ML techniques. The approach can reveal more insights into the code's workings and help develop more robust test cases.
Challenges
Data Overload: While continuous profiling performs real-time monitoring, it can generate extensive data that can become difficult to analyze. Aggregation and visualization tools can mitigate these problems by letting developers focus on critical performance indicators. Also, filtering data according to the desired criteria can help remove irrelevant data.
Integration Complexity: Integrating profiling tools within source code is complex and becomes more challenging in distributed architectures. Developers can address these issues by implementing automated profiling pipelines for each component and using a centralized dashboard to analyze data across the system.
Cost: Profiling tools and scaling can be expensive for extensive enterprise systems. Identifying the key areas to monitor and setting clear goals can help organizations reduce profiling granularity and scope, allowing for more efficient scaling and lowering data collection and storage costs.
Profiling Tools
Developers can use state-of-the-art profiling tools to streamline monitoring workflows. Below is a list of the top tools for continuous profiling that provide diverse functionality and support multiple frameworks.
Datadog Continuous Profiler
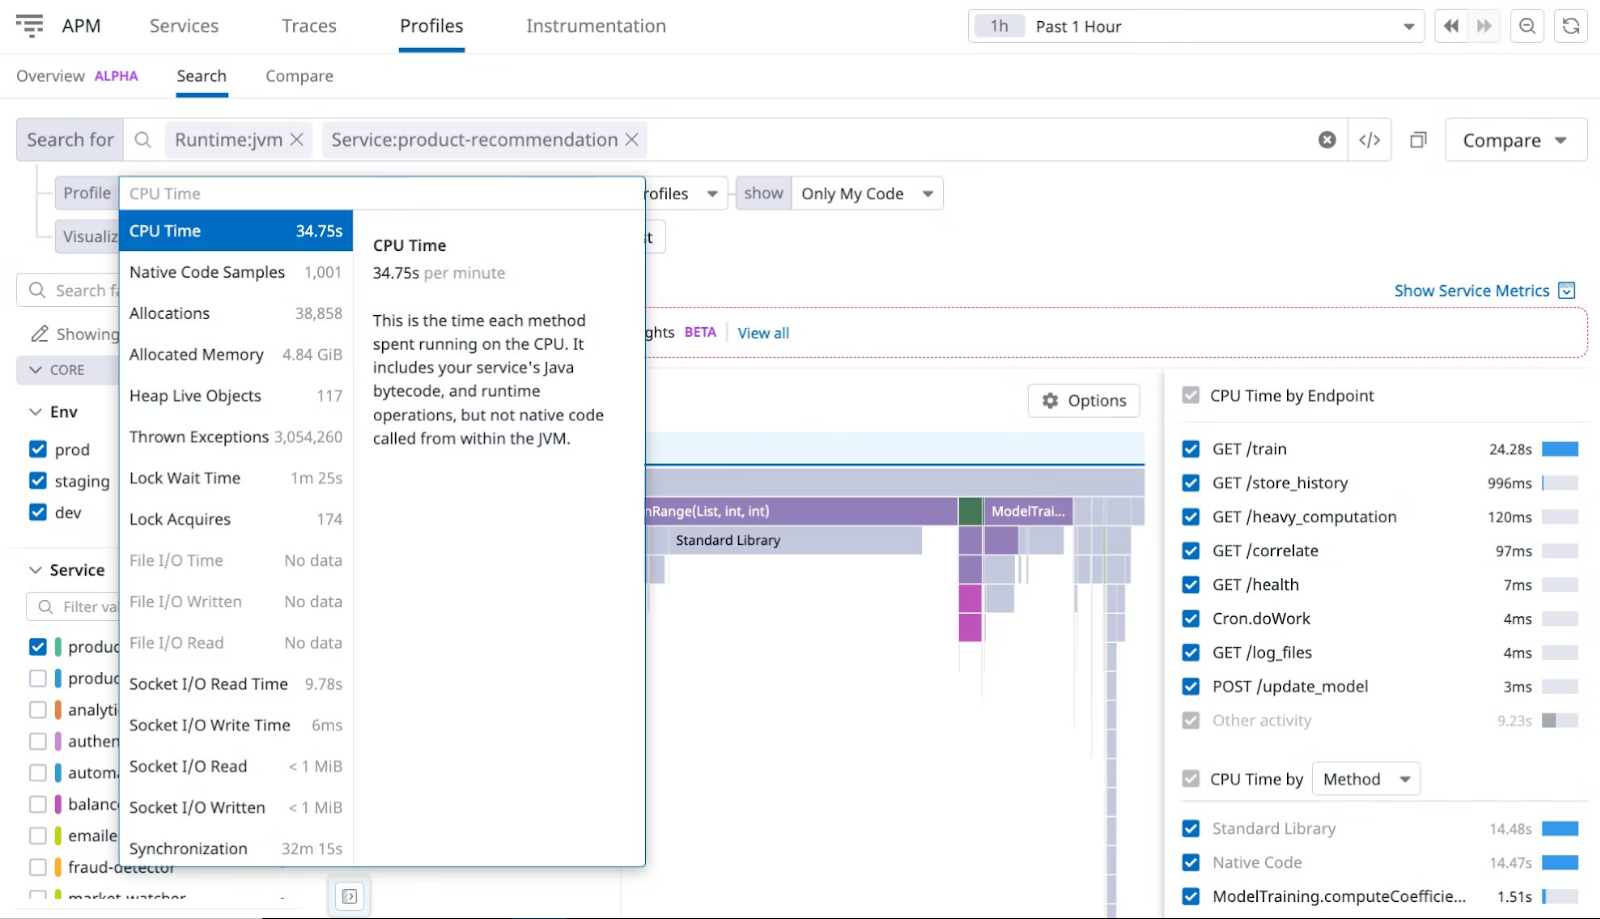
Datadog offers a high-quality continuous profiler that gathers and analyzes performance data for your code base. It works in any environment and helps you resolve production issues using AI-based insights.
 Datadog Continuous Profiler.png
Figure: Datadog Continuous Profiler
The tool monitors each line of code across all systems, containers, and hosts, highlighting blocks that perform inefficiently with different production loads. It also offers thread-level visibility that lets you correlate spans and identify the root cause of slow requests.
Amazon CodeGuru Profiler
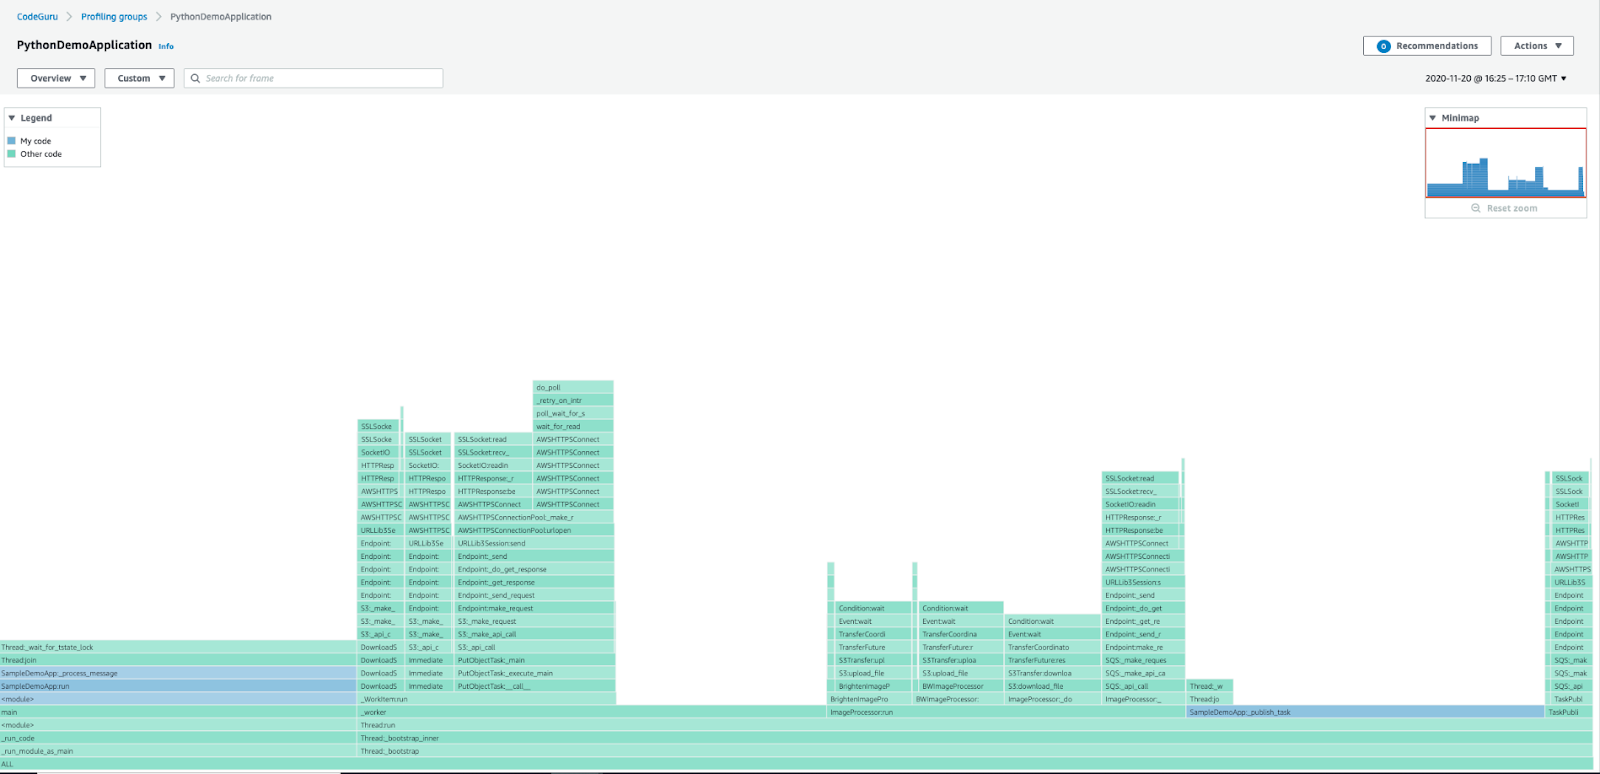
Amazon CodeGuru Profiler lets developers identify vulnerabilities, anomalies, and runtime inefficiencies through ML and automated reasoning techniques. The tool supports Python and Java applications.
 Amazon CodeGuru Profiler.png
Figure: Amazon CodeGuru Profiler
It offers automated bug tracking and suggestions for fixing code to speed up debugging. Interactive flame graphs and heap summaries help you visualize code paths and object allocation through heap usage analysis.
Google Cloud Profiler
The Google Cloud Profiler is a lightweight continuous profiling tool for monitoring CPU and memory usage data across production applications. It works with Python, Node.js, Go, and Java frameworks.
 Google Cloud Profiler.png
The tool links usage data to source code to help you identify the origin of a specific problem. It also has an intuitive interface with multiple features to control visualization. For instance, you can filter performance data based on profiler types, zones, and timespan.
Zilliz Cloud Monitoring & Observability
Zilliz Cloud is a fully managed vector database service powered by Milvus. It empowers you to unlock the full potential of unstructured data for your AI applications. It is also ideal for many popular use cases, such as retrieval augmented generation (RAG), natural language processing (NLP), semantic search, image search, recommendation systems, and AI chatbots.
With vector databases like Zilliz Cloud playing a crucial role in modern AI applications, evaluating their real-time performance is essential. Zilliz Cloud has recently introduced a comprehensive monitoring functionality to track system performance and status in real-time. These enhancements provide customizable alerts and monitor a range of key metrics, including CPU usage, latency, queries per second, vectors per second, and storage consumption. The system also tracks the number of loaded entities alongside entity and collection counts, ensuring full visibility into database operations.
 Zilliz Cloud monitoring.png
Figure: Zilliz Cloud monitoring
You can also integrate alerts with predefined thresholds and severity levels with multiple notification channels so you never miss an important event.
How to Choose a Profiling Tool?
Although the list above offers a few suitable options, you must select a tool that aligns with your specific use case and goals. The points below highlight a few things you must consider when investing in a profiling tool.
Low Overhead: When collecting performance data, the tool must have minimal impact on your existing operations and infrastructure.
Language and Platform Support: The tool must be compatible with your application’s programming language and framework.
Data Visualization: Look for visualization features that can help you focus on critical metrics through intuitive dashboards and interactive functionality.
Scalability: Ensure the tool is easy to scale across distributed environments, supporting growth without compromising performance.
FAQs About Continuous Profiling
- Is continuous profiling resource-intensive?
Continuous profiling uses lightweight profilers to collect data with minimal overhead to record relevant statistics in production environments.
- Can continuous profiling detect memory leaks?
Yes. Continuous profiling can identify leaks by monitoring memory utilization patterns over time.
- How is continuous profiling different from logging?
Logging records specific event sequences, while continuous profiling records more extensive performance data regarding resource usage, such as CPU consumption, memory utilization, and I/O operations.
- What types of performance metrics does continuous profiling track?
Continuous profiling tracks CPU usage, memory utilization, I/O operations, and latency statistics.
- What are the types of continuous profiling?
Sampling and instrumentation profiling are the two methods for monitoring performance metrics. A sampling profiler records data at intervals while instrumentation profiles code at different checkpoints.
Related Resources
Although continuous profiling pertains to performance monitoring for all systems, the resources below will help you understand how the method works for vector databases.
- What is Continuous Profiling?
- How Does Continuous Profiling Work?
- Data Visualization
- Traditional vs. Continuous Profiling
- Benefits and Challenges of Continuous Profiling
- Profiling Tools
- Zilliz Cloud Monitoring & Observability
- How to Choose a Profiling Tool?
- FAQs About Continuous Profiling
- Related Resources
Content
Start Free, Scale Easily
Try the fully-managed vector database built for your GenAI applications.
Try Zilliz Cloud for Free