A good error-handling strategy for Gemini 3 tool calls starts with assuming that both the model and the tools can fail in different ways. The model might return malformed arguments, pick the wrong tool, or misinterpret the result, while the tools themselves may time out or return unexpected data. You should always validate tool-call inputs and outputs against your schemas before executing anything. If arguments are missing or invalid, your backend should catch that and decide whether to correct, re-prompt, or show an error.
One effective pattern is to use a clear “tool result wrapper” when sending results back to Gemini 3. For example, always respond with a JSON object that includes fields like success, data, and error_message. If the tool failed or returned partial results, you can send success: false along with the error details. The model can then see that something went wrong and choose a different strategy: re-try with modified arguments, ask for clarification, or fall back to another tool. You can guide this behavior in your system prompt: “If a tool returns success: false, try a different approach or explain the problem.”
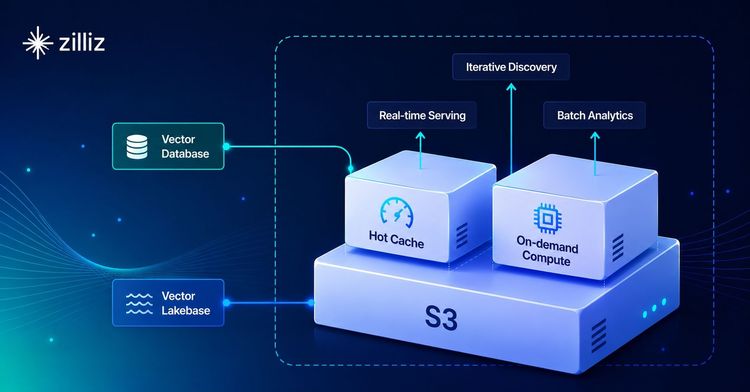
In production systems, logging and monitoring are also key. You should log every tool call, its arguments, and its outcomes, so you can analyze failure patterns over time. If your tools interact with external systems like vector databases, for exampleMilvus or Zilliz Cloud., you should also log retrieval errors, timeouts, or unexpected empty results. This helps you distinguish between model mistakes and infrastructure issues. Over time, you can refine prompts, adjust tool schemas, and add guardrails (like hard limits on actions) based on real error data, making your Gemini 3–powered workflow much more stable.


