Visualization frameworks help developers debug and optimize complex LangChain or LangGraph systems. LangGraph itself provides native graph visualization using tools like Graphviz or D3.js. These visualizations map nodes (agents or functions) and edges (data dependencies), helping developers track state transitions and event triggers in real time.
For richer analytics, integrations with observability tools like LangSmith or OpenTelemetry can display execution timelines, latency histograms, and dependency graphs. Developers can correlate performance metrics with specific nodes or agents.
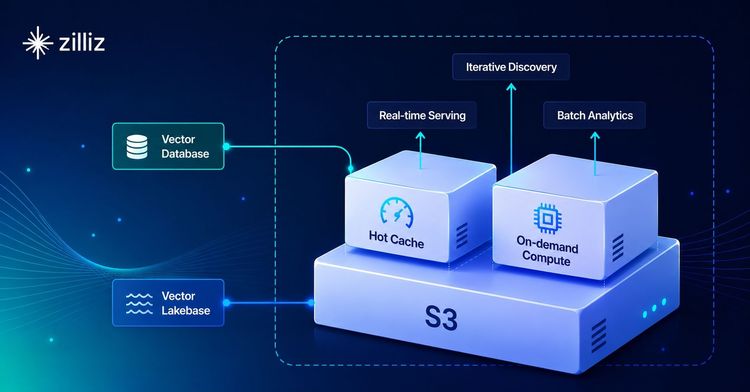
When vector retrieval is involved, Milvus metrics dashboards can complement these tools by monitoring query latency and recall. Combined visualization of orchestration flow and retrieval performance gives a complete picture of system health and optimization opportunities.


