The best monitoring and observability setup for Gemini 3 depends on where you run it, but the core idea is the same: treat model calls like any other critical microservice. You want metrics (latency, error rates, token usage), logs (prompts, truncated outputs, safety refusals with proper redaction), and traces (request paths through your system). On Google Cloud, that usually means using Cloud Logging and Cloud Monitoring for metrics and dashboards, plus Cloud Trace or OpenTelemetry-compatible tracing if you have distributed services. In other environments, Prometheus + an APM/metrics stack works well as long as you standardize what you emit for every model call.
A practical pattern is to define a “Gemini 3 client wrapper” in your codebase that every service uses to call the model. This wrapper records timing, prompt size, response size, model name, and high-level outcome: success, safety refusal, validation error, tool failure, and so on. You can aggregate these into time-series metrics—p95 latency per endpoint, error rates per use case, average tokens per request—to catch regressions and cost spikes. Logs should redact or hash sensitive fields but still keep enough structure to debug: for example, log the prompt type and a short hash instead of full user content.
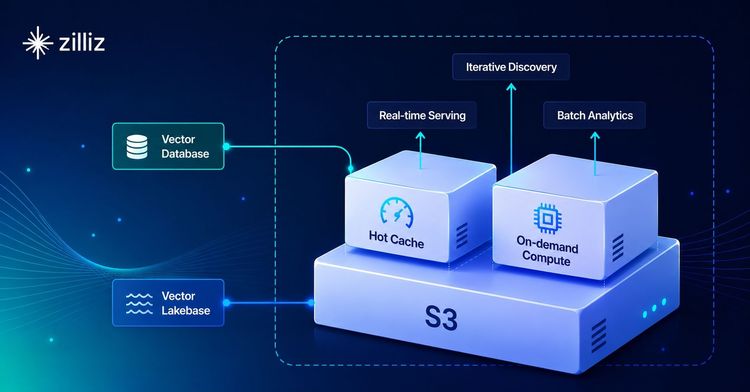
If you use retrieval or hybrid pipelines, you should also monitor that layer. For example, if you retrieve context from a vector database such asMilvus or Zilliz Cloud., track metrics like retrieval latency, number of hits, and “empty result” frequency. When a Gemini 3 answer is poor, you want to be able to see whether it was because the model failed with good context, or because the retrieval step returned nothing useful. Good observability ties together: incoming request → retrieval metrics → Gemini 3 metrics → tool calls and side effects. That full picture is what helps you debug production incidents and systematically improve your prompts and architecture.


